Weekly Market Breadth Report — May 08, 2026
This report is AI-generated from EQTRun's market data and breadth analytics. It is not human-written market commentary and does not constitute investment advice.
Market Overview
S&P 500 rallied this week (+2.3%) to 7,399. MSCI World (ACWI) gained +2.5% to 155. Momentum (4/6) and trend (5/6) breadth are both positive — constructive backdrop across timeframes. Best performer: Nikkei 225 (+5.4%). Weakest: FTSE 100 (-1.3%).
| Metric | This Week | Last Week | 1Y Avg | Z (1Y) |
|---|---|---|---|---|
| Bullish Signal % | 61.7% | 51.8% | 55.4% | +0.6 |
| Bullish Signals | 112,552 | 100,416 | ||
| Bearish Signals | 69,902 | 93,254 |
Slightly more bullish than the 1-year weekly average (z=+0.6).
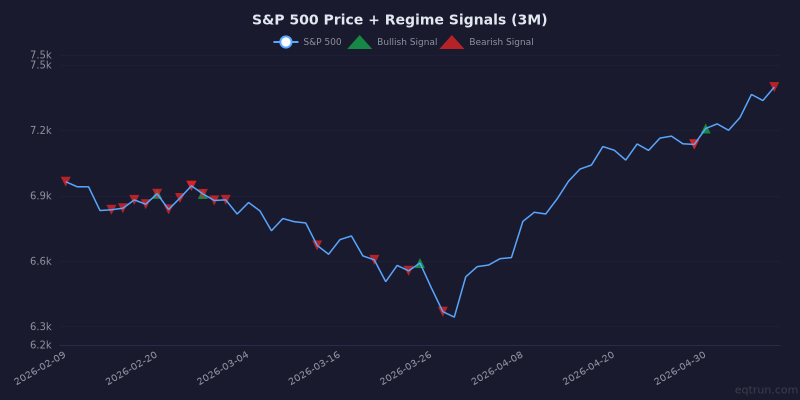
S&P 500 price with regime signal markers. Green triangles = bullish signals, red triangles = bearish signals.
Key Takeaways
- 🟢 S&P 500: Rallied +2.3% to 7,399. Both momentum and trend breadth are positive — the rally has broad participation.
- 🟢 MSCI World (ACWI): Gained +2.5%, tracking US markets. The rally is global.
- 🟡 Breadth: Momentum is mid-range (4/6) while trend is strong (5/6). The structural move may already be priced in — this combination has historically led to below-average forward returns.
- 🟡 S&P 500: McClellan Oscillator crossed below zero — breadth momentum shifted from positive to negative.
Stocks with the Most Signals
Large-cap stocks ($10B+) with 5+ signals fired this week.
| Symbol | Name | Sector | Signals | Net | 1W % |
|---|---|---|---|---|---|
| INTC | Intel Corporation | Technology | 26 | +18 | +25% |
| FLEX | Flex Ltd. | Technology | 26 | +22 | +55% |
| 6274.TWO | Taiwan Union Technology Corpor | Technology | 25 | +23 | +36% |
| MU | Micron Technology, Inc. | Technology | 24 | +22 | +38% |
| ABEV3.SA | Ambev S.A. | Consumer Defensive | 23 | +15 | +12% |
| MTSI | MACOM Technology Solutions Hol | Technology | 23 | +15 | +27% |
| 3443.TW | Global Unichip Corp. | Technology | 23 | +19 | +22% |
| GOOG | Alphabet Inc. | Communication Services | 22 | +16 | +4% |
Momentum Breadth
Short-term oscillators and price velocity indicators.
| Index | This Week | Last Week | Change | Z (1Y) | Trend |
|---|---|---|---|---|---|
| Advance / Decline | +7,306 | -588 | +7,894 | +0.7 | Flipped bullish |
| New 20D High/Low | +4,029 | +1,230 | +2,799 | +0.2 | Strengthening |
| MACD Breadth | +612 | -3,846 | +4,458 | +0.2 | Flipped bullish |
| RSI Extremes | -971 | -986 | +15 | -0.1 | Stable |
| Bollinger Band | -1,551 | +172 | -1,723 | -0.1 | Flipped bearish |
| Weekly Movers (±10%) | +6,216 | +127 | +6,089 | +0.5 | Strengthening |
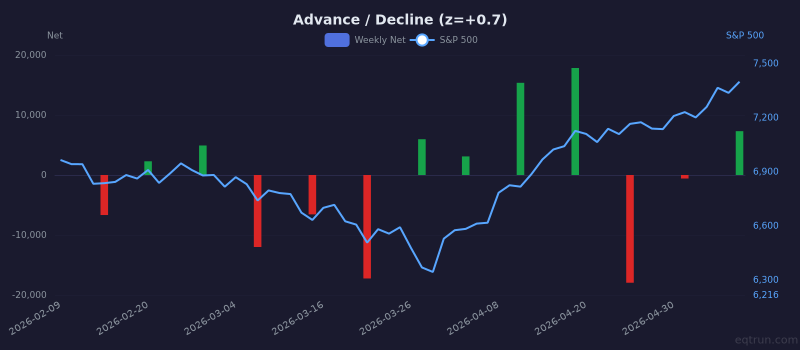
Advance / Decline weekly net (bars) with S&P 500 price (right axis). 1Y z-score: +0.7.
Trend Breadth
Longer-term structural indicators.
| Index | This Week | Last Week | Change | Z (1Y) | Trend |
|---|---|---|---|---|---|
| 52-Week High/Low | +2,228 | +1,440 | +788 | -0.2 | Strengthening |
| Fresh 52W High/Low | +380 | +145 | +235 | -0.1 | Strengthening |
| 200 DMA Breadth | +7,988 | +4,444 | +3,544 | -0.6 | Strengthening |
| MA Cross (Golden/Death) | -184 | -250 | +66 | -0.7 | Improving |
| HH/HL Structure | +210 | +101 | +109 | +0.0 | Strengthening |
| Breakout / Breakdown | +536 | +473 | +63 | -0.6 | Strengthening |
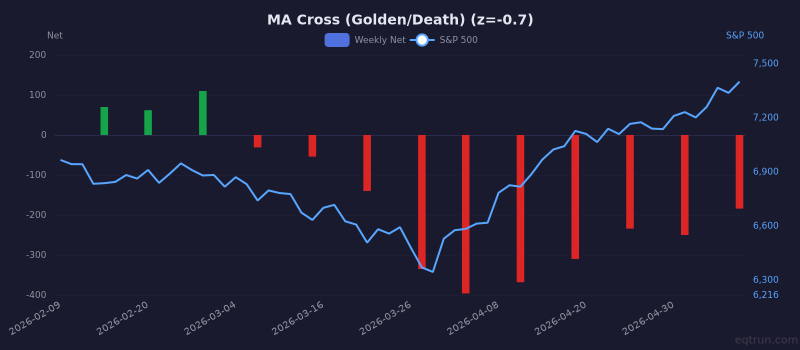
MA Cross (Golden/Death) weekly net (bars) with S&P 500 price (right axis). 1Y z-score: -0.7.
Pattern Breadth
| Index | This Week | Last Week | Change | Z (1Y) | Trend |
|---|---|---|---|---|---|
| Double Top/Bottom | +140 | -14 | +154 | +0.1 | Flipped bullish |
| Failed Pattern | +65 | +17 | +48 | +0.3 | Strengthening |
Major ETF Signals
| Ticker | Name | Momentum | Trend | Pattern | Net | Z (1Y) |
|---|---|---|---|---|---|---|
| QQQ | NASDAQ 100 | 8↑ 1↓ | 10↑ | — | +17 | +2.6 |
| SPY | S&P 500 | 6↑ 3↓ | 9↑ | — | +12 | +1.7 |
| EEM | Emerging Markets | 6↑ 1↓ | 9↑ | — | +14 | +2.0 |
| IWM | Russell 2000 | 2↑ 4↓ | 9↑ | — | +7 | +1.1 |
| GLD | Gold | 5↑ 2↓ | 3↑ 1↓ | — | +5 | +0.5 |
| TLT | 20+ Year Treasury | 5↑ 2↓ | 2↑ | — | +5 | +1.4 |
| IBIT | Bitcoin | 4↑ 4↓ | 1↑ | — | +1 | +0.2 |
| EWJ | Japan | 5↑ | 1↑ | — | +6 | +1.1 |
| HYG | High Yield Corp | 6↑ | — | — | +6 | +1.2 |
| USO | Oil (USO) | 4↓ | 1↓ | — | -5 | -1.5 |
| EFA | EAFE (Dev ex-US) | 1↑ 1↓ | 1↑ 1↓ | — | +0 | -0.5 |
| DIA | Dow Jones | 1↑ 1↓ | — | — | +0 | -0.3 |
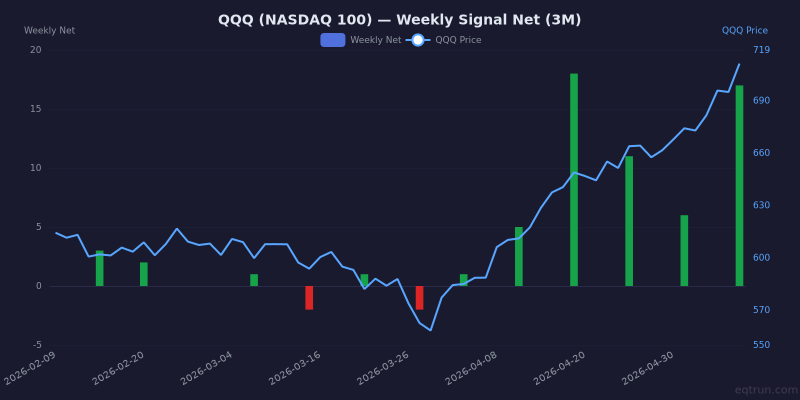
QQQ weekly net signals (bars) with QQQ price (blue line, right axis). 1Y z-score: +2.6.
Sector Breadth (Advance/Decline)
| Sector | Net | % Bullish | Z (1Y) |
|---|---|---|---|
| Industrials | +2,025 | 57.5% | +0.9 |
| Technology | +1,971 | 59.7% | +1.1 |
| Consumer Cyclical | +1,416 | 58.1% | +1.1 |
| Basic Materials | +785 | 55.4% | +0.7 |
| Financial Services | +729 | 54.2% | +0.5 |
| Real Estate | +472 | 55.4% | +0.7 |
| Communication Services | +315 | 56.0% | +0.9 |
| Consumer Defensive | +59 | 50.7% | +0.2 |
| Healthcare | +53 | 50.4% | +0.2 |
| Utilities | +38 | 51.0% | +0.0 |
| Energy | -642 | 36.0% | -2.1 |
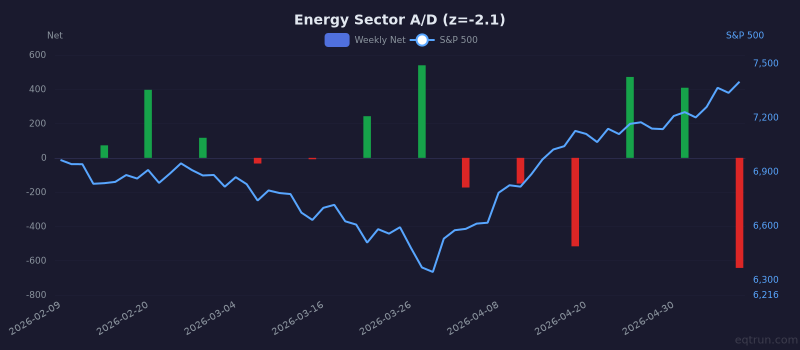
Energy sector weekly A/D net with S&P 500 price (right axis). 1Y z-score: -2.1.
What to Watch Next Week
- MA Cross (Golden/Death) at -184. Improving but still negative.
- Advance / Decline leading at +7,306. Watch for continuation vs exhaustion.
- Advance / Decline just flipped — need follow-through to confirm.
Last Week We Said
From our report on May 01:
- 🟢 S&P 500: Rallied +1.4% to 7,265. Both momentum and trend breadth are positive — the rally has broad participation.
- 🟢 MSCI World (ACWI): Gained +1.3%, tracking US markets. The rally is global.
- 🟡 Breadth: Momentum is mid-range (3/6) while trend is strong (5/6). The structural move may already be priced in — this combination has historically led to below-average forward returns.
What happened: S&P 500 rallied +2.3% this week. The bullish signals were on track.
Get this report in your inbox every Saturday
Free for all EQTRun users. Plus daily signal alerts, custom screens, PDF exports, and live breadth/regime dashboards.
Create free account →