Weekly Market Breadth Report — April 24, 2026
This report is AI-generated from EQTRun's market data and breadth analytics. It is not human-written market commentary and does not constitute investment advice.
Market Overview
S&P 500 was roughly flat this week (+0.5%) to 7,165. MSCI World (ACWI) was flat at -0.3% to 150. Momentum is weak (2/6) while trend is in the mid-range (4/6). Short-term selling pressure within a mixed structural backdrop — below-average forward returns historically. Best performer: Nikkei 225 (+2.1%). Weakest: CAC 40 (-3.2%).
| Metric | This Week | Last Week | 1Y Avg | Z (1Y) |
|---|---|---|---|---|
| Bullish Signal % | 44.7% | 63.3% | 55.0% | -1.3 |
| Bullish Signals | 88,316 | 123,099 | ||
| Bearish Signals | 109,330 | 71,338 |
This week's net balance skews bearish relative to the 1-year norm (z=-1.3).
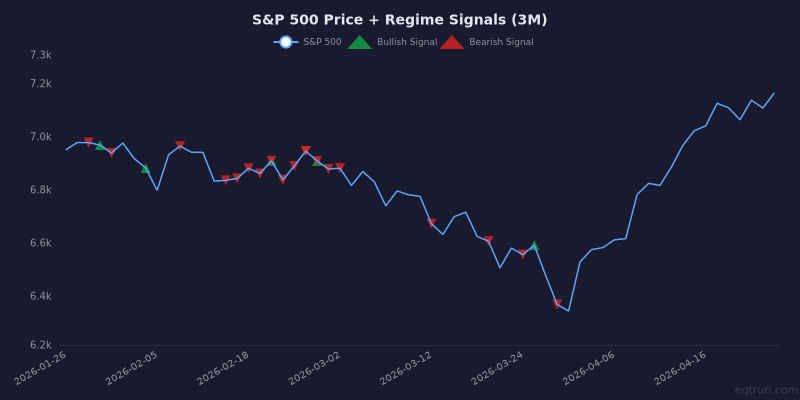
S&P 500 price with regime signal markers. Green triangles = bullish signals, red triangles = bearish signals.
Key Takeaways
- 🟡 S&P 500: Flat this week at 7,165 (+0.5%).
- 🟡 Breadth: Momentum is weak (2/6) while trend is in the mid-range (4/6). Short-term selling pressure within a mixed structural backdrop — below-average forward returns. Momentum just weakened — a fresh deterioration in short-term indicators.
- 🔴 Breadth — Advance / Decline: At an extreme reading (z=-1.6). Uncommon weakness — could mark a washout or further downside.
- 🟡 DAX 40: A McClellan Zero Cross signal fired this week (bearish).
Stocks with the Most Signals
Large-cap stocks ($10B+) with 5+ signals fired this week.
| Symbol | Name | Sector | Signals | Net | 1W % |
|---|---|---|---|---|---|
| AMKR | Amkor Technology, Inc. | Technology | 28 | +24 | +16% |
| ON | ON Semiconductor Corporation | Technology | 27 | +21 | +18% |
| 002938.SZ | Avary Holding(Shenzhen)Co., Li | Technology | 26 | +18 | +15% |
| 034020.KS | Doosan Enerbility Co., Ltd. | Industrials | 26 | +24 | +17% |
| ARM | Arm Holdings plc | Technology | 26 | +24 | +41% |
| 2454.TW | MediaTek Inc. | Technology | 26 | +18 | +26% |
| 3017.TW | Asia Vital Components Co., Ltd | Technology | 25 | +19 | +23% |
| 4958.TW | Zhen Ding Technology Holding L | Technology | 25 | +21 | +23% |
Momentum Breadth
Short-term oscillators and price velocity indicators.
| Index | This Week | Last Week | Change | Z (1Y) | Trend |
|---|---|---|---|---|---|
| Advance / Decline | -17,955 | +17,833 | -35,788 | -1.6 | Flipped bearish |
| New 20D High/Low | +6,084 | +16,981 | -10,897 | +0.5 | Deteriorating |
| MACD Breadth | -3,582 | +1,402 | -4,984 | -1.3 | Flipped bearish |
| RSI Extremes | -2,479 | -863 | -1,616 | -0.8 | Weakening |
| Bollinger Band | -5,117 | -5,233 | +116 | -1.1 | Stable |
| Weekly Movers (±10%) | +6,412 | +14,534 | -8,122 | +0.6 | Deteriorating |
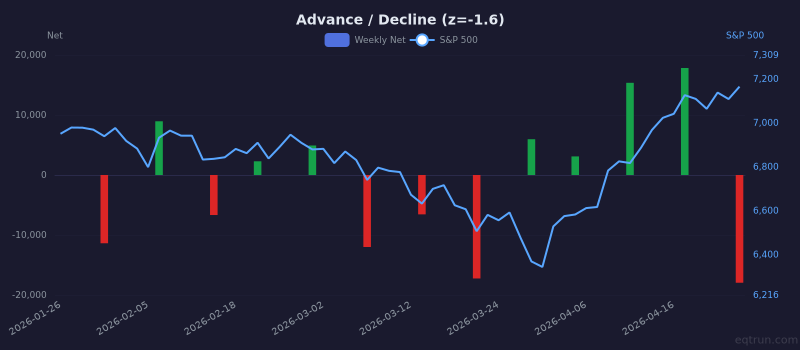
Advance / Decline weekly net (bars) with S&P 500 price (right axis). 1Y z-score: -1.6.
Trend Breadth
Longer-term structural indicators.
| Index | This Week | Last Week | Change | Z (1Y) | Trend |
|---|---|---|---|---|---|
| 52-Week High/Low | +2,974 | +4,272 | -1,298 | +0.1 | Deteriorating |
| Fresh 52W High/Low | +340 | +1,012 | -672 | -0.2 | Deteriorating |
| 200 DMA Breadth | +7,711 | +8,305 | -594 | -0.6 | Stable |
| MA Cross (Golden/Death) | -234 | -310 | +76 | -0.9 | Improving |
| HH/HL Structure | -276 | -462 | +186 | -0.5 | Improving |
| Breakout / Breakdown | +764 | +1,387 | -623 | -0.3 | Deteriorating |
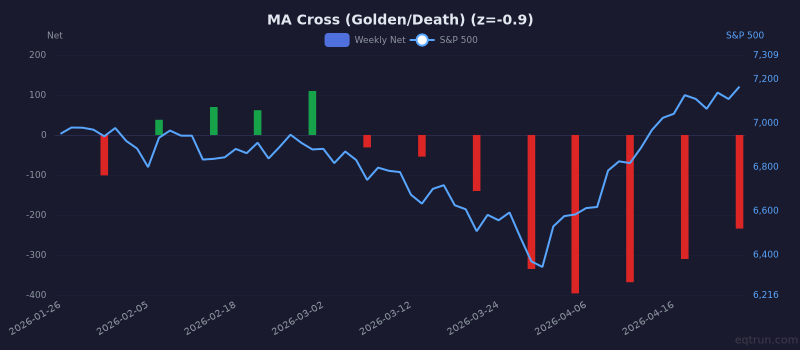
MA Cross (Golden/Death) weekly net (bars) with S&P 500 price (right axis). 1Y z-score: -0.9.
Pattern Breadth
| Index | This Week | Last Week | Change | Z (1Y) | Trend |
|---|---|---|---|---|---|
| Double Top/Bottom | +156 | +381 | -225 | +0.2 | Deteriorating |
| Failed Pattern | +41 | +502 | -461 | +0.2 | Deteriorating |
Major ETF Signals
| Ticker | Name | Momentum | Trend | Pattern | Net | Z (1Y) |
|---|---|---|---|---|---|---|
| QQQ | NASDAQ 100 | 4↑ 2↓ | 8↑ | 1↑ | +11 | +1.7 |
| IWM | Russell 2000 | 1↑ 4↓ | 3↑ | — | +0 | -0.3 |
| IBIT | Bitcoin | 2↑ 5↓ | — | — | -3 | -0.6 |
| SPY | S&P 500 | 2↑ 3↓ | 2↑ | — | +1 | -0.4 |
| USO | Oil (USO) | 3↑ 1↓ | 2↑ | — | +4 | +1.2 |
| EWJ | Japan | 4↓ | — | — | -4 | -1.4 |
| TLT | 20+ Year Treasury | 1↓ | 1↑ 1↓ | — | -1 | -0.4 |
| EEM | Emerging Markets | 3↓ | — | — | -3 | -1.1 |
| HYG | High Yield Corp | 3↓ | — | — | -3 | -0.9 |
| EFA | EAFE (Dev ex-US) | 2↓ | — | — | -2 | -0.9 |
| GLD | Gold | 2↓ | — | — | -2 | -0.8 |
| DIA | Dow Jones | 1↓ | — | — | -1 | -0.5 |
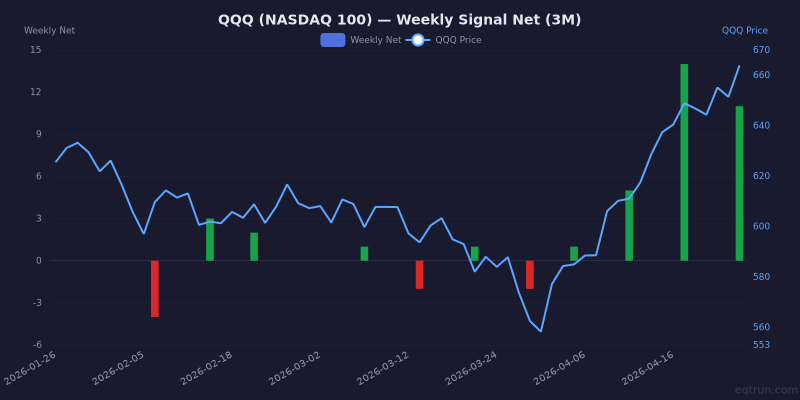
QQQ weekly net signals (bars) with QQQ price (blue line, right axis). 1Y z-score: +1.7.
Sector Breadth (Advance/Decline)
| Sector | Net | % Bullish | Z (1Y) |
|---|---|---|---|
| Energy | +472 | 59.3% | +1.3 |
| Utilities | -77 | 48.3% | -0.4 |
| Communication Services | -785 | 38.3% | -1.9 |
| Real Estate | -1,007 | 39.3% | -1.8 |
| Consumer Defensive | -1,057 | 40.4% | -1.8 |
| Basic Materials | -1,378 | 42.7% | -1.0 |
| Technology | -1,623 | 44.1% | -0.7 |
| Financial Services | -1,985 | 39.3% | -1.9 |
| Healthcare | -2,388 | 36.9% | -1.9 |
| Consumer Cyclical | -3,352 | 35.3% | -2.2 |
| Industrials | -3,656 | 40.1% | -1.4 |
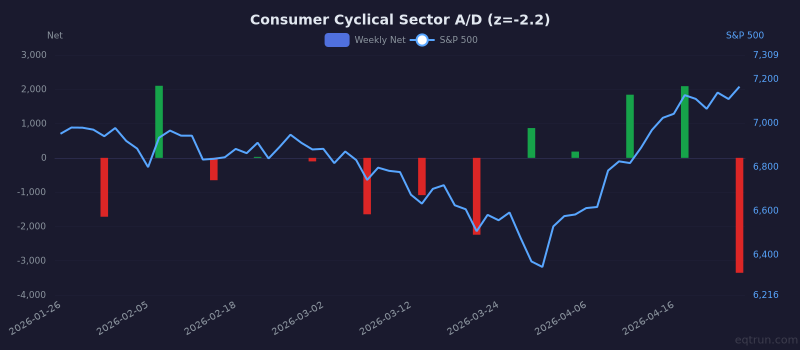
Consumer Cyclical sector weekly A/D net with S&P 500 price (right axis). 1Y z-score: -2.2.
What to Watch Next Week
- HH/HL Structure at -276. Improving but still negative.
- Weekly Movers (±10%) leading at +6,412. Watch for continuation vs exhaustion.
- Advance / Decline just flipped — need follow-through to confirm.
Last Week We Said
From our report on April 17:
- 🟡 S&P 500: Rallied +4.5% to 7,126, but breadth is not fully confirming. Price is moving up while internals remain mixed.
- 🟢 MSCI World (ACWI): Gained +4.0%, tracking US markets. The rally is global.
- 🟡 Breadth: Momentum (4/6) and trend (4/6) are both in the mid-range. Near-baseline forward returns — no strong directional signal from breadth.
What happened: S&P 500 was flat (+0.5%). The mixed signals were warranted — no clear direction.
Get this report in your inbox every Saturday
Free for all EQTRun users. Plus daily signal alerts, custom screens, PDF exports, and live breadth/regime dashboards.
Create free account →