Weekly Market Breadth Report — April 17, 2026
This report is AI-generated from EQTRun's market data and breadth analytics. It is not human-written market commentary and does not constitute investment advice.
Market Overview
S&P 500 rallied this week (+4.5%) to 7,126. MSCI World (ACWI) gained +4.0% to 151. Momentum (4/6) and trend (4/6) are both in the mid-range — near-baseline forward returns historically. Best performer: NASDAQ Composite (+6.8%). Weakest: FTSE 100 (+0.6%).
| Metric | This Week | Last Week | 1Y Avg | Z (1Y) |
|---|---|---|---|---|
| Bullish Signal % | 65.2% | 66.8% | 55.9% | +1.3 |
| Bullish Signals | 132,789 | 119,562 | ||
| Bearish Signals | 70,936 | 59,482 |
This week's net balance skews bullish relative to the 1-year norm (z=+1.3).
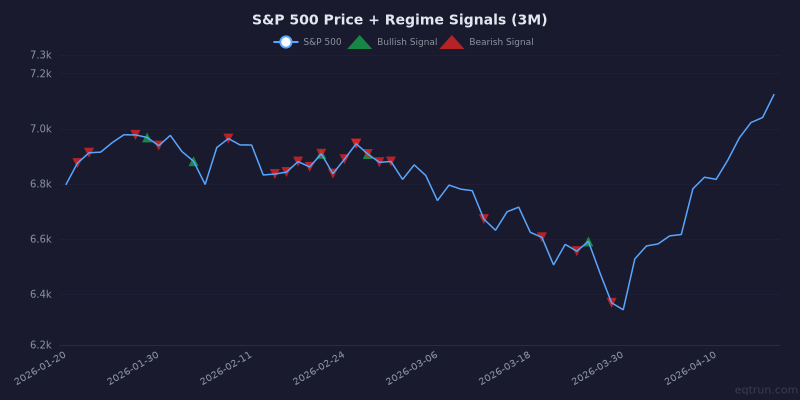
S&P 500 price with regime signal markers. Green triangles = bullish signals, red triangles = bearish signals.
Key Takeaways
- 🟡 S&P 500: Rallied +4.5% to 7,126, but breadth is not fully confirming. Price is moving up while internals remain mixed.
- 🟢 MSCI World (ACWI): Gained +4.0%, tracking US markets. The rally is global.
- 🟡 Breadth: Momentum (4/6) and trend (4/6) are both in the mid-range. Near-baseline forward returns — no strong directional signal from breadth.
- 🟢 Breadth — Failed Pattern: At an extreme reading (z=+1.9). Uncommon strength suggesting real conviction.
- 🟢 Dow Jones: A 90% Day signal fired this week (bullish).
Stocks with the Most Signals
Large-cap stocks ($10B+) with 5+ signals fired this week.
| Symbol | Name | Sector | Signals | Net | 1W % |
|---|---|---|---|---|---|
| UI | Ubiquiti Inc. | Technology | 29 | +27 | +17% |
| 2327.TW | Yageo Corporation | Technology | 29 | +21 | +11% |
| RVMD | Revolution Medicines, Inc. | Healthcare | 28 | +24 | +54% |
| RBI.VI | Raiffeisen Bank International | Financial Services | 27 | +21 | +6% |
| CAR | Avis Budget Group, Inc. | Industrials | 27 | +21 | +65% |
| 300750.SZ | Contemporary Amperex Technolog | Industrials | 26 | +14 | +7% |
| 009155.KS | Samsung Electro-Mechanics Co., | Technology | 26 | +24 | +28% |
| GRMN | Garmin Ltd. | Technology | 25 | +19 | +4% |
Momentum Breadth
Short-term oscillators and price velocity indicators.
| Index | This Week | Last Week | Change | Z (1Y) | Trend |
|---|---|---|---|---|---|
| Advance / Decline | +17,833 | +15,364 | +2,469 | +1.7 | Strengthening |
| New 20D High/Low | +16,981 | +8,081 | +8,900 | +1.8 | Strengthening |
| MACD Breadth | +1,402 | +6,490 | -5,088 | +0.4 | Deteriorating |
| RSI Extremes | -863 | +299 | -1,162 | -0.0 | Flipped bearish |
| Bollinger Band | -5,233 | -2,592 | -2,641 | -1.2 | Weakening |
| Weekly Movers (±10%) | +14,534 | +9,552 | +4,982 | +1.8 | Strengthening |
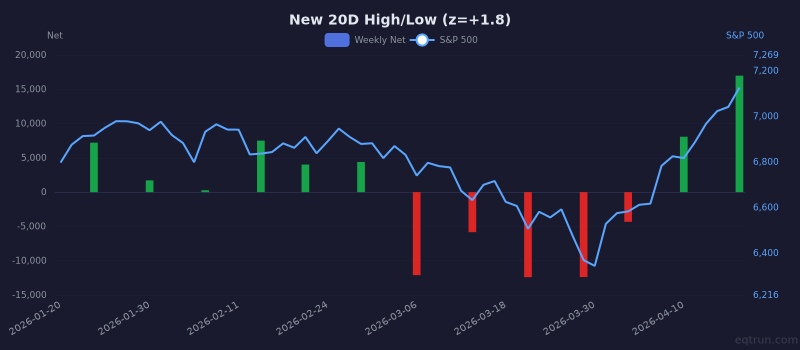
New 20D High/Low weekly net (bars) with S&P 500 price (right axis). 1Y z-score: +1.8.
Trend Breadth
Longer-term structural indicators.
| Index | This Week | Last Week | Change | Z (1Y) | Trend |
|---|---|---|---|---|---|
| 52-Week High/Low | +4,272 | +2,402 | +1,870 | +0.5 | Strengthening |
| Fresh 52W High/Low | +1,012 | +691 | +321 | +0.8 | Strengthening |
| 200 DMA Breadth | +8,305 | -751 | +9,056 | -0.6 | Flipped bullish |
| MA Cross (Golden/Death) | -310 | -368 | +58 | -1.2 | Improving |
| HH/HL Structure | -462 | -647 | +185 | -0.7 | Improving |
| Breakout / Breakdown | +1,387 | +667 | +720 | +0.5 | Strengthening |
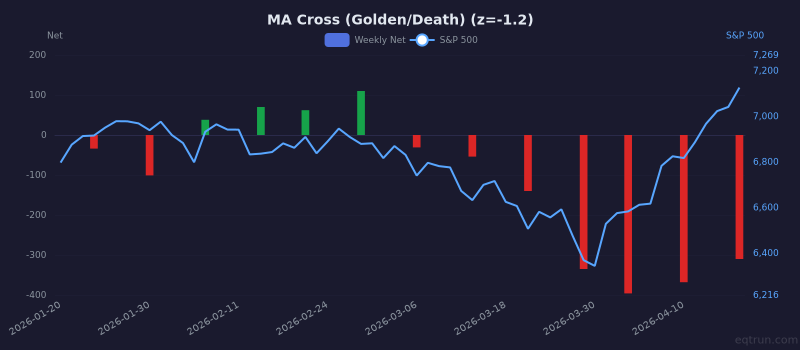
MA Cross (Golden/Death) weekly net (bars) with S&P 500 price (right axis). 1Y z-score: -1.2.
Pattern Breadth
| Index | This Week | Last Week | Change | Z (1Y) | Trend |
|---|---|---|---|---|---|
| Double Top/Bottom | +381 | +204 | +177 | +0.6 | Strengthening |
| Failed Pattern | +502 | +623 | -121 | +1.9 | Deteriorating |
Major ETF Signals
| Ticker | Name | Momentum | Trend | Pattern | Net | Z (1Y) |
|---|---|---|---|---|---|---|
| SPY | S&P 500 | 10↑ 2↓ | 9↑ | — | +17 | +2.9 |
| QQQ | NASDAQ 100 | 10↑ 1↓ | 9↑ | — | +18 | +3.1 |
| IWM | Russell 2000 | 10↑ 2↓ | 5↑ | — | +13 | +2.5 |
| EEM | Emerging Markets | 10↑ 2↓ | 1↑ | — | +9 | +1.2 |
| HYG | High Yield Corp | 4↑ 1↓ | 1↓ | — | +2 | +0.3 |
| EFA | EAFE (Dev ex-US) | 4↑ 1↓ | — | — | +3 | +0.1 |
| DIA | Dow Jones | 4↑ 1↓ | — | — | +3 | +0.4 |
| TLT | 20+ Year Treasury | 1↓ | 2↑ 1↓ | — | +0 | -0.1 |
| USO | Oil (USO) | 1↓ | 1↑ 2↓ | — | -2 | -1.0 |
| IBIT | Bitcoin | 2↑ 1↓ | — | — | +1 | +0.1 |
| EWJ | Japan | 2↑ 1↓ | — | — | +1 | -0.2 |
| GLD | Gold | 2↑ 1↓ | — | — | +1 | -0.2 |
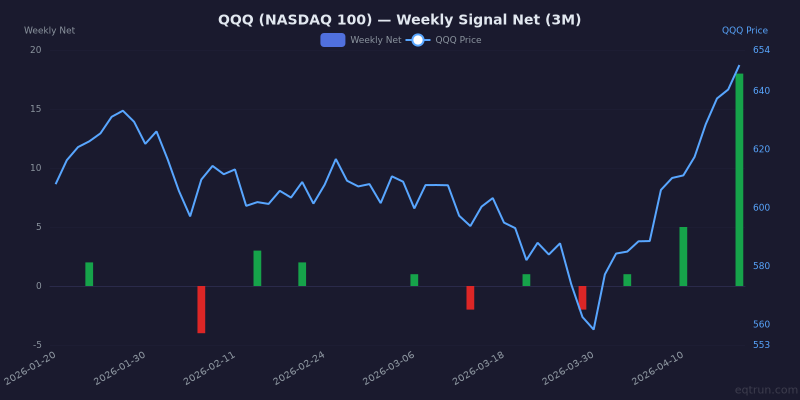
QQQ weekly net signals (bars) with QQQ price (blue line, right axis). 1Y z-score: +3.1.
Sector Breadth (Advance/Decline)
| Sector | Net | % Bullish | Z (1Y) |
|---|---|---|---|
| Technology | +4,503 | 66.7% | +2.4 |
| Industrials | +2,722 | 57.5% | +1.2 |
| Financial Services | +2,205 | 62.2% | +1.8 |
| Consumer Cyclical | +2,091 | 59.5% | +1.6 |
| Healthcare | +1,814 | 60.3% | +1.8 |
| Real Estate | +1,261 | 63.1% | +2.1 |
| Communication Services | +1,059 | 66.1% | +2.9 |
| Basic Materials | +1,059 | 55.8% | +0.9 |
| Consumer Defensive | +546 | 55.1% | +1.1 |
| Utilities | -33 | 49.3% | -0.3 |
| Energy | -516 | 39.5% | -1.8 |
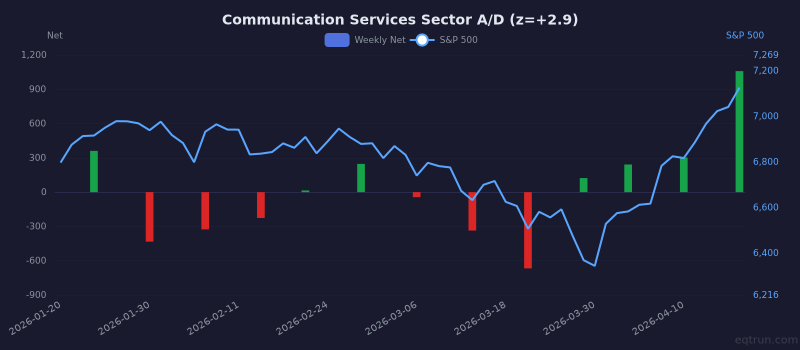
Communication Services sector weekly A/D net with S&P 500 price (right axis). 1Y z-score: +2.9.
What to Watch Next Week
- HH/HL Structure at -462. Improving but still negative.
- Advance / Decline leading at +17,833. Watch for continuation vs exhaustion.
- RSI Extremes just flipped — need follow-through to confirm.
Last Week We Said
From our report on April 10:
- 🟡 S&P 500: Rallied +3.6% to 6,817, but breadth is not fully confirming. Price is moving up while internals remain mixed.
- 🟢 MSCI World (ACWI): Gained +4.0%, tracking US markets. The rally is global.
- 🟢 Breadth: Momentum is strong (5/6) with trend in the mid-range (3/6). Broad short-term participation while the structural picture is still mixed — near-baseline forward returns historically. Need trend confirmation for a sustained move. Trend is recovering.
What happened: S&P 500 rallied +4.5% this week. The bullish signals were on track.
Get this report in your inbox every Saturday
Free for all EQTRun users. Plus daily signal alerts, custom screens, PDF exports, and live breadth/regime dashboards.
Create free account →