Weekly Market Breadth Report — April 03, 2026
This report is AI-generated from EQTRun's market data and breadth analytics. It is not human-written market commentary and does not constitute investment advice.
Market Overview
S&P 500 rallied this week (+3.4%) to 6,583. MSCI World (ACWI) gained +3.6% to 139. Momentum breadth is improving (5/6 positive) but trend structure remains weak (1/6 positive). This is a classic late-correction divergence — short-term bounce within a longer downtrend. Best performer: FTSE 100 (+4.7%). Weakest: Nikkei 225 (-0.5%).
| Metric | This Week | Last Week | 1Y Avg | Z (1Y) |
|---|---|---|---|---|
| Bullish Signal % | 55.8% | 50.6% | 54.7% | +0.2 |
| Bullish Signals | 94,451 | 102,285 | ||
| Bearish Signals | 74,954 | 99,984 |
Signal balance is near its 1-year norm — nothing unusual this week.
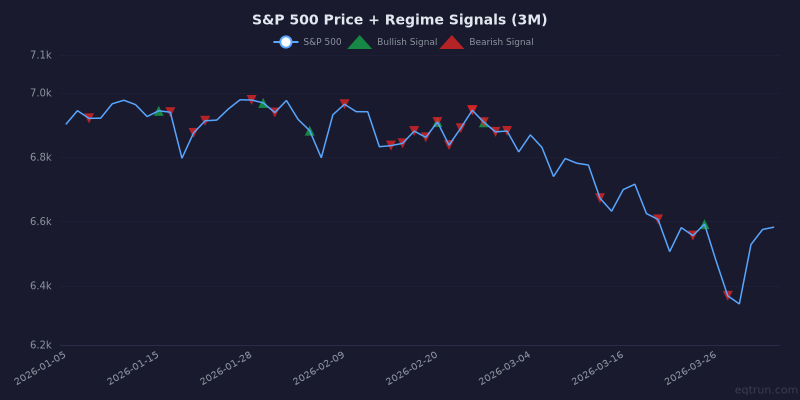
S&P 500 price with regime signal markers. Green triangles = bullish signals, red triangles = bearish signals.
Key Takeaways
- 🟡 S&P 500: Rallied +3.4% to 6,583. Short-term momentum breadth (5/6 positive) is confirming the bounce, but trend structure (1/6 positive) hasn't turned yet. This is the classic setup for a strong but potentially short-lived rally.
- 🟢 MSCI World (ACWI): Gained +3.6%, tracking US markets. The rally is global, not just a US story.
- 🟡 Global breadth: Mixed signals this week. Breakout / Breakdown, Weekly Movers (±10%) flipped bullish, but HH/HL Structure turned bearish. The market is in transition — not yet a clear trend in either direction.
- 🔴 Global breadth — MA Cross (Golden/Death): At an extreme reading (z=-1.5). This level of weakness is uncommon. Could mark a washout or the beginning of something worse.
- 🔴 Nikkei 225: A High/Low Divergence signal fired this week. This signal has fired 182 times historically on Nikkei 225 — a quantitative warning flag worth noting alongside the other data.
Stocks with the Most Signals
Large-cap stocks ($10B+) with 5+ signals fired this week.
| Symbol | Name | Sector | Signals | Net | 1W % |
|---|---|---|---|---|---|
| 600066.SS | Yutong Bus Co.,Ltd. | Industrials | 25 | +21 | +16% |
| 601869.SS | Yangtze Optical Fibre And Cabl | Technology | 24 | +22 | +28% |
| 001979.SZ | China Merchants Shekou Industr | Real Estate | 24 | -24 | -8% |
| PFE | Pfizer Inc. | Healthcare | 22 | +20 | +5% |
| NKE | NIKE, Inc. | Consumer Cyclical | 21 | -9 | -14% |
| 000250.KQ | Sam Chun Dang Pharm. Co., Ltd | Healthcare | 21 | -11 | -42% |
| 3988.HK | Bank of China Limited | Financial Services | 21 | +17 | +4% |
| 5110.SR | Saudi Electricity Company | Utilities | 21 | +17 | +8% |
Momentum Breadth
Short-term oscillators and price velocity indicators.
| Index | This Week | Last Week | Change | Z (1Y) | Trend |
|---|---|---|---|---|---|
| Advance / Decline | +3,097 | +5,964 | -2,867 | +0.4 | Deteriorating |
| New 20D High/Low | -4,325 | -12,378 | +8,053 | -0.8 | Improving |
| MACD Breadth | +3,744 | +1,551 | +2,193 | +1.3 | Strengthening |
| RSI Extremes | +1,596 | +4,070 | -2,474 | +1.1 | Deteriorating |
| Bollinger Band | +2,022 | +6,152 | -4,130 | +0.8 | Deteriorating |
| Weekly Movers (±10%) | +565 | -5,977 | +6,542 | -0.3 | Flipped bullish |
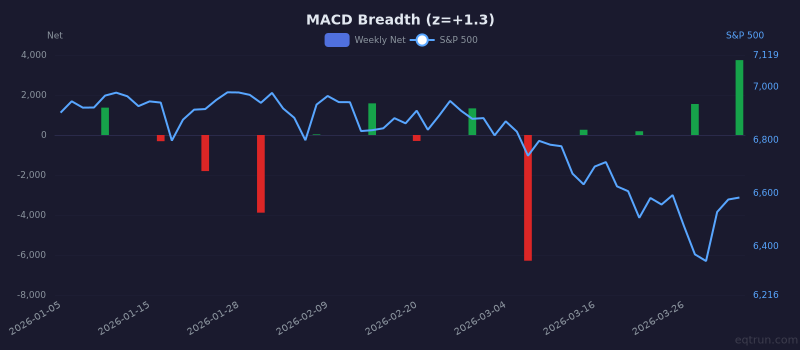
MACD Breadth weekly net (bars) with S&P 500 price (right axis). 1Y z-score: +1.3.
Trend Breadth
Longer-term structural indicators.
| Index | This Week | Last Week | Change | Z (1Y) | Trend |
|---|---|---|---|---|---|
| 52-Week High/Low | -874 | -2,471 | +1,597 | -1.1 | Improving |
| Fresh 52W High/Low | -55 | -624 | +569 | -0.7 | Improving |
| 200 DMA Breadth | -8,102 | -8,539 | +437 | -1.4 | Stable |
| MA Cross (Golden/Death) | -396 | -335 | -61 | -1.5 | Weakening |
| HH/HL Structure | -4 | +246 | -250 | -0.2 | Flipped bearish |
| Breakout / Breakdown | +156 | -361 | +517 | -1.0 | Flipped bullish |
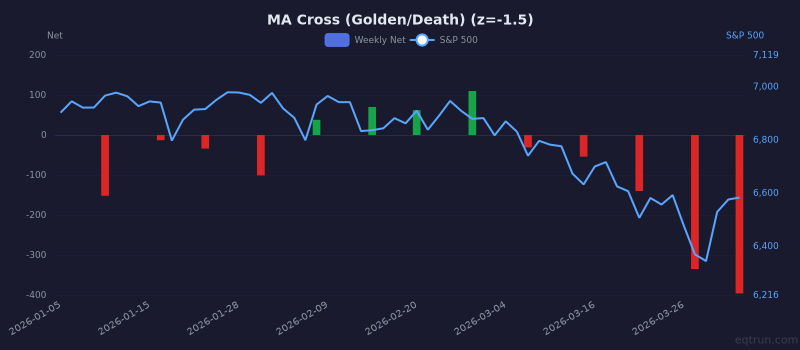
MA Cross (Golden/Death) weekly net (bars) with S&P 500 price (right axis). 1Y z-score: -1.5.
Pattern Breadth
| Index | This Week | Last Week | Change | Z (1Y) | Trend |
|---|---|---|---|---|---|
| Double Top/Bottom | -331 | -972 | +641 | -0.8 | Improving |
| Failed Pattern | +218 | +141 | +77 | +1.0 | Strengthening |
Major ETF Signals
| Ticker | Name | Momentum | Trend | Pattern | Net | Z (1Y) |
|---|---|---|---|---|---|---|
| EEM | Emerging Markets | 5↑ 2↓ | 1↑ 2↓ | — | +2 | -0.1 |
| SPY | S&P 500 | 6↑ 2↓ | 2↓ | — | +2 | -0.1 |
| QQQ | NASDAQ 100 | 5↑ 2↓ | 2↓ | — | +1 | -0.2 |
| DIA | Dow Jones | 5↑ 2↓ | 2↓ | — | +1 | -0.0 |
| IWM | Russell 2000 | 3↑ 2↓ | 1↑ 2↓ | — | +0 | -0.3 |
| EWJ | Japan | 3↑ 2↓ | 2↑ | — | +3 | +0.3 |
| EFA | EAFE (Dev ex-US) | 3↑ 1↓ | 2↑ | — | +4 | +0.3 |
| HYG | High Yield Corp | 3↑ | 2↑ 1↓ | — | +4 | +0.8 |
| IBIT | Bitcoin | 4↑ | 1↑ | — | +5 | +0.9 |
| GLD | Gold | 2↑ | 2↑ 1↓ | — | +3 | +0.1 |
| TLT | 20+ Year Treasury | 4↑ | — | — | +4 | +1.1 |
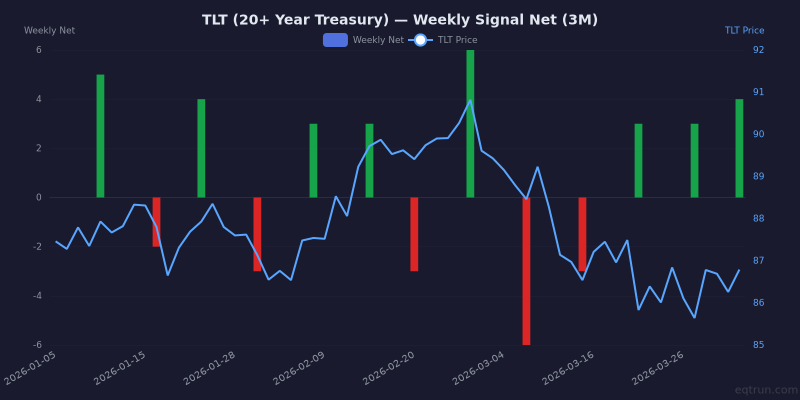
TLT weekly net signals (bars) with TLT price (blue line, right axis). 1Y z-score: +1.1.
Sector Breadth (Advance/Decline)
| Sector | Net | % Bullish | Z (1Y) |
|---|---|---|---|
| Financial Services | +1,649 | 61.3% | +1.5 |
| Healthcare | +948 | 56.4% | +1.1 |
| Real Estate | +655 | 58.3% | +1.2 |
| Communication Services | +242 | 54.3% | +0.9 |
| Consumer Defensive | +200 | 52.1% | +0.5 |
| Consumer Cyclical | +183 | 51.0% | +0.3 |
| Utilities | +101 | 52.6% | +0.3 |
| Energy | -173 | 45.6% | -0.8 |
| Technology | -235 | 49.0% | +0.1 |
| Industrials | -364 | 48.9% | -0.1 |
| Basic Materials | -546 | 46.6% | -0.4 |
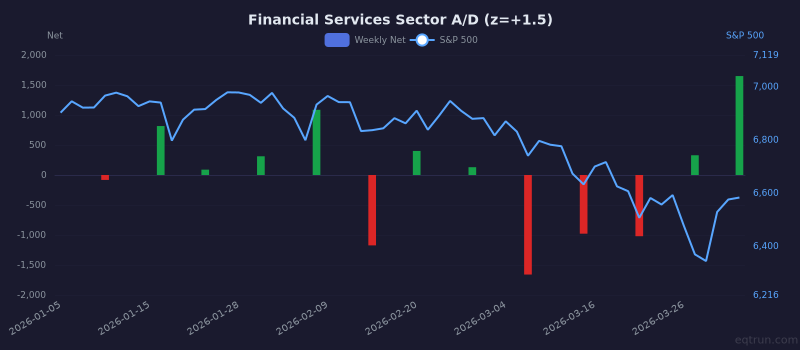
Financial Services sector weekly A/D net with S&P 500 price (right axis). 1Y z-score: +1.5.
What to Watch Next Week
- 200 DMA Breadth at -8,102. Improving but still negative.
- MACD Breadth leading at +3,744. Watch for continuation vs exhaustion.
- HH/HL Structure just flipped — need follow-through to confirm.
Get this report in your inbox every Saturday
Free for all EQTRun users. Plus daily signal alerts, custom screens, PDF exports, and live breadth/regime dashboards.
Create free account →