williams_r
Williams %R
Range: -100 to 0. Bullish: %R crosses above oversold (-80) from below. Bearish: %R crosses below overbought (-20) from above.
Signal family
Mean reversion — Oscillator-based signals that fire at overbought or oversold extremes — typically fade the prevailing move.
Parameters
| Name | Description | Default | Range |
|---|---|---|---|
| period | Lookback period | 14 | 5–50 |
| overbought | Overbought level | -20 | -30–-10 |
| oversold | Oversold level | -80 | -90–-70 |
Historical context
865,713 valid triggers on 3,716 distinct tickers between 2015-02-24 and 2026-04-22. Universe: us_only · mcap ≥ $100,000,000 · price ≥ $1 (3,716 tickers). Entry at open T+1. 1d = intraday T+1; 20d = open T+1 to close T+20.
Benchmarks: spxew (S&P 500 Equal Weight — the primary benchmark here; a median-stock view that avoids the 2020+ megacap-concentration distortion), spx (S&P 500, cap-weighted), and msci (MSCI World USD). Per-stock regime: trending = ADX(14) ≥ 25, high vol = 20d ann. vol ≥ 20%.
At a glance (20d alpha vs S&P 500 Equal Weight, US-only)
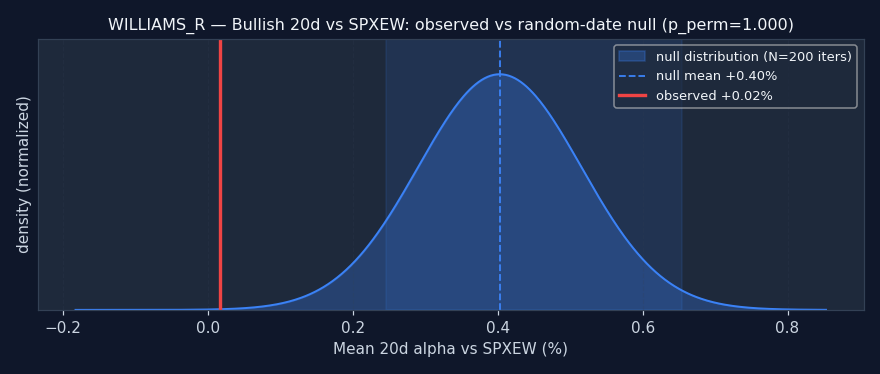
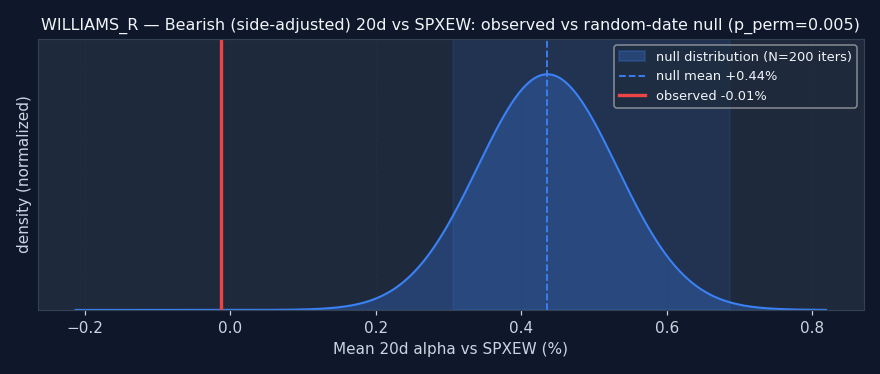
Reading this: the random-date null is: for each ticker, sample N random dates and compute the same alpha — what alpha does a signal with no information produce? If the signal's observed alpha beats the null (pperm≤0.05), it's adding real information. If it's inside or worse than the null, the signal doesn't add value over random firing — any observed alpha is either noise or a universe artifact.
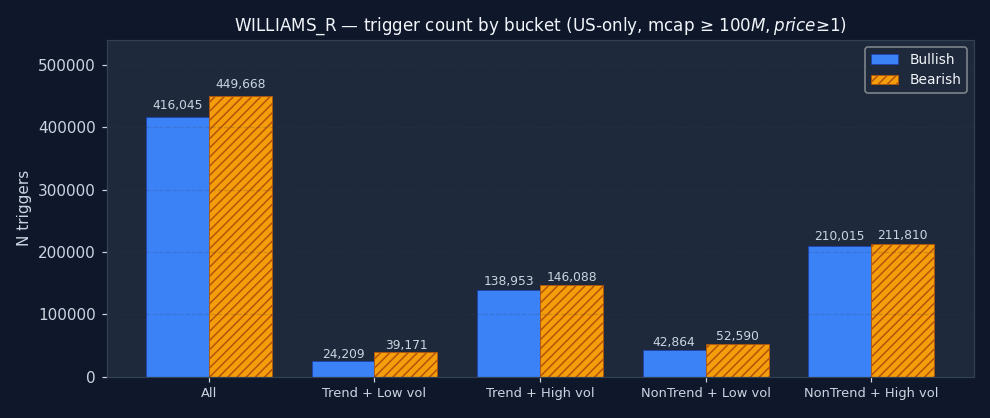
How often does WILLIAMS_R fire in each regime?
The signal's bucket distribution is itself informative. If 50%+ of all WILLIAMS_R triggers fire in the "non-trending + high vol" quadrant, the signal is structurally a chop-market event — regardless of what its textbook definition claims. Bullish and bearish are shown separately; counts are across the full US-only sample after the mcap and price floor.
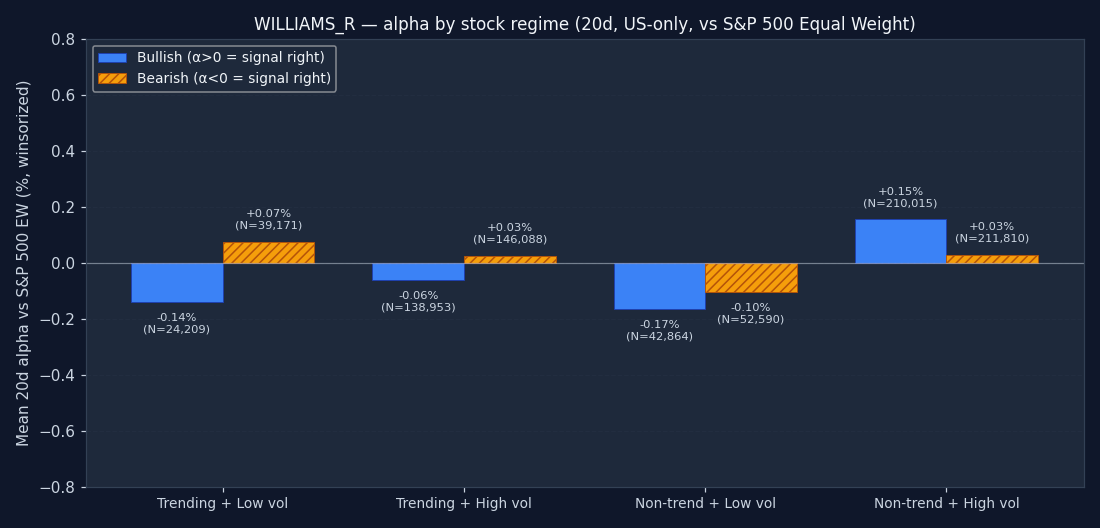
Per-stock regime quadrant — 20d alpha
Each trigger is tagged with the host stock's own technical regime on the trigger date: is the stock itself in a trend (ADX(14) ≥ 25) or ranging? And is its realized 20-day volatility high (≥ 20% annualized) or low? This is the textbook conditioning variable — "does this signal work better in trending stocks?" — answered at the level of the individual stock, not the market. Positive bars are good for the signal; negative bars mean alpha vanishes into the benchmark or worse.
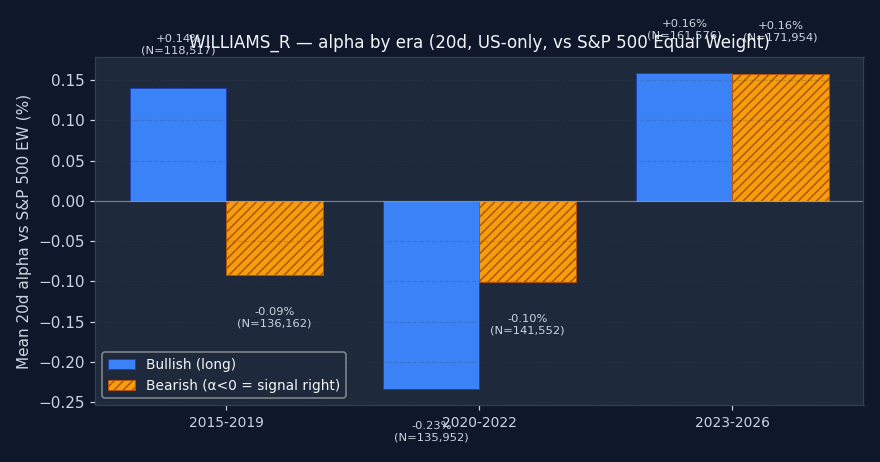
Sub-period check — does the signal work in every era?
A multi-year average can hide major instability. We split the sample into three non-overlapping windows: 2015–2019 (pre-COVID, normalized monetary policy), 2020–2022 (pandemic crash + recovery + rate-shock bear), and 2023+ (post-ZIRP, AI megacap rally). If a signal's alpha is positive overall but comes entirely from one era, that's a red flag — the conditions that produced it may not repeat. A robust signal shows a consistent sign across all non-empty buckets.
↑ Bullish triggers
| Bench | Metric | 1d | 5d | 20d | 60d | 252d |
|---|---|---|---|---|---|---|
| spx | Stock % | -0.04% | +0.11% | +1.00% | +3.06% | +12.48% |
| Bench % | -0.01% | +0.25% | +1.19% | +3.37% | +13.91% | |
| Alpha % | -0.03% | -0.13% | -0.17% | -0.29% | -1.41% | |
| Median alpha | -0.05% | -0.24% | -0.63% | -1.77% | -8.76% | |
| Hit rate (α>0) | 48.6% | 47.3% | 46.9% | 45.1% | 39.6% | |
| p (naive) | <0.001 | <0.001 | <0.001 | <0.001 | <0.001 | |
| p (HAC) | <0.001 | <0.001 | <0.001 | <0.001 | <0.001 | |
| N | 415,865 | 415,358 | 411,916 | 402,106 | 367,283 | |
| msci | Stock % | -0.04% | +0.11% | +1.00% | +3.06% | +12.48% |
| Bench % | +0.07% | +0.28% | +1.14% | +3.01% | +11.75% | |
| Alpha % | -0.09% | -0.18% | -0.10% | +0.06% | +0.71% | |
| Median alpha | -0.12% | -0.30% | -0.57% | -1.40% | -6.53% | |
| Hit rate (α>0) | 47.0% | 46.7% | 47.1% | 46.1% | 42.1% | |
| p (naive) | <0.001 | <0.001 | <0.001 | 0.0798 | <0.001 | |
| p (HAC) | <0.001 | <0.001 | 0.0001 | 0.4089 | 0.0300 | |
| N | 414,609 | 411,616 | 408,448 | 400,162 | 365,683 | |
| spxew | Stock % | -0.04% | +0.11% | +1.00% | +3.06% | +12.48% |
| Bench % | +0.01% | +0.18% | +1.06% | +2.79% | +10.48% | |
| Alpha % | -0.04% | -0.07% | +0.02% | +0.28% | +2.20% | |
| Median alpha | -0.07% | -0.18% | -0.42% | -1.14% | -5.27% | |
| Hit rate (α>0) | 48.0% | 48.0% | 47.8% | 46.7% | 43.4% | |
| p (naive) | <0.001 | <0.001 | 0.3444 | <0.001 | <0.001 | |
| p (HAC) | <0.001 | <0.001 | 0.5208 | 0.0001 | <0.001 | |
| N | 414,132 | 412,136 | 408,408 | 399,229 | 362,559 |
Permutation null detail — all horizons × both benchmarks
| Horizon | Bench | Observed α | Null mean | Null 95% CI | pperm |
|---|---|---|---|---|---|
| 1d | spx | -0.03% | -0.00% | [-0.03%, +0.19%] | 0.811 |
| 1d | msci | -0.09% | -0.03% | [-0.05%, +0.16%] | 1.000 |
| 1d | spxew | -0.04% | -0.03% | [-0.05%, +0.16%] | 0.279 |
| 5d | spx | -0.13% | +0.12% | [-0.01%, +0.39%] | 1.000 |
| 5d | msci | -0.18% | +0.13% | [-0.01%, +0.40%] | 1.000 |
| 5d | spxew | -0.07% | +0.15% | [+0.02%, +0.42%] | 1.000 |
| 20d | spx | -0.17% | +0.21% | [+0.05%, +0.46%] | 1.000 |
| 20d | msci | -0.10% | +0.33% | [+0.18%, +0.59%] | 1.000 |
| 20d | spxew | +0.02% | +0.40% | [+0.25%, +0.65%] | 1.000 |
| 60d | spx | -0.29% | +0.40% | [+0.20%, +0.71%] | 1.000 |
| 60d | msci | +0.06% | +0.85% | [+0.64%, +1.15%] | 1.000 |
| 60d | spxew | +0.28% | +1.07% | [+0.86%, +1.38%] | 1.000 |
| 252d | spx | -1.41% | +0.90% | [+0.55%, +1.32%] | 1.000 |
| 252d | msci | +0.71% | +3.21% | [+2.85%, +3.65%] | 1.000 |
| 252d | spxew | +2.20% | +4.58% | [+4.25%, +5.01%] | 1.000 |
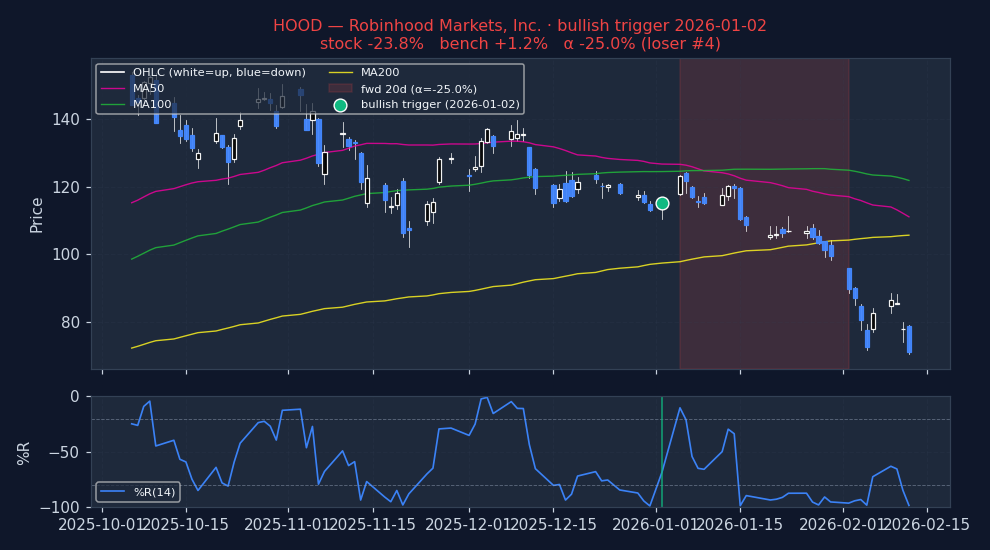
Example triggers on US large-caps (2023+, mcap ≥ $30B)
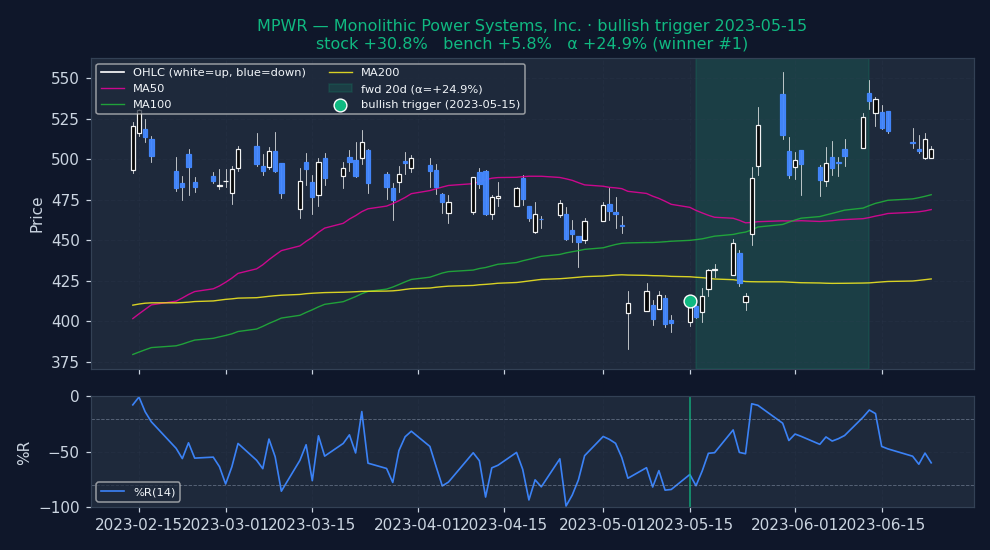
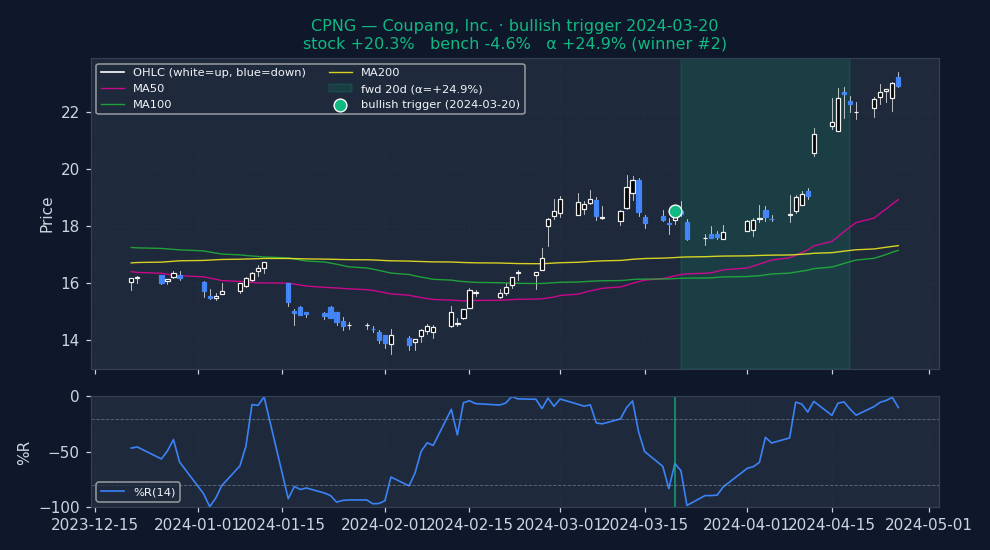
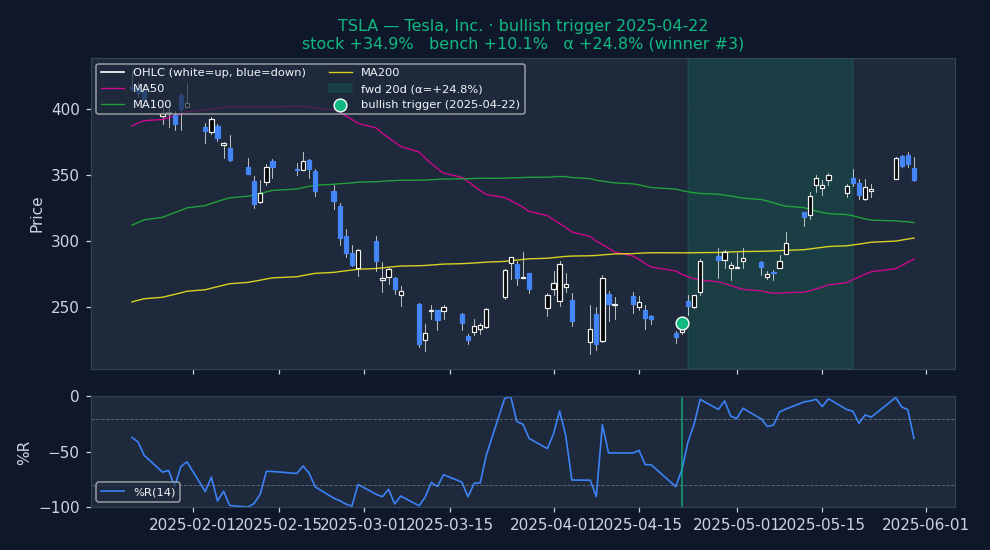
Six recent bullish WILLIAMS_R triggers on US mega-caps, filtered to |alpha| ≤ 25% to exclude catalyst-driven outliers (earnings surprises, M&A, binary events). The first three are the strongest outcomes — what the signal looks like when it works. The last three are the weakest — what the signal looks like when it fails. Each chart shows the stock's price with signal-appropriate technical overlays (e.g. MACD subpanel on MACD pages, Bollinger Bands on Bollinger pages, the 52-week trailing max line on 52w-high pages), a dot marking the trigger date, and the forward window shaded (green when the signal was right, red when it wasn't). Click any chart to open full-size.
Strongest outcomes (what WILLIAMS_R looks like when it works)
Weakest outcomes (what WILLIAMS_R looks like when it fails)
Stock-regime quadrants (2×2 per-stock, 20d alpha detail table)
| Quadrant | N | Stock % (spx) | Bench % (spx) | Alpha % (spx) | p (HAC) | Stock % (msci) | Bench % (msci) | Alpha % (msci) | p (HAC) | Stock % (spxew) | Bench % (spxew) | Alpha % (spxew) | p (HAC) |
|---|---|---|---|---|---|---|---|---|---|---|---|---|---|
| Trending + Low vol Clean directional grind, low whipsaw | 24,209 | +0.23% | +0.69% | -0.45% | <0.001 | +0.23% | +0.55% | -0.30% | <0.001 | +0.23% | +0.43% | -0.14% | 0.0047 |
| Trending + High vol Crisis selloff or parabolic rally | 138,953 | +1.04% | +1.38% | -0.33% | <0.001 | +1.04% | +1.24% | -0.22% | <0.001 | +1.04% | +1.12% | -0.06% | 0.2084 |
| Non-trending + Low vol Quiet chop, summer doldrums | 42,864 | +0.27% | +0.80% | -0.49% | <0.001 | +0.27% | +0.64% | -0.34% | <0.001 | +0.27% | +0.48% | -0.17% | <0.001 |
| Non-trending + High vol Classical "whipsaw zone" for momentum | 210,015 | +1.25% | +1.21% | +0.07% | 0.0891 | +1.25% | +1.21% | +0.07% | 0.0723 | +1.25% | +1.15% | +0.15% | <0.001 |
Sub-period breakdown table (20d alpha)
| Period | N | Alpha % (spx) | p (HAC) | Alpha % (msci) | p (HAC) | Alpha % (spxew) | p (HAC) |
|---|---|---|---|---|---|---|---|
| 2015-2019 2015-01-01 → 2020-01-01 | 118,517 | +0.05% | 0.2147 | +0.18% | <0.001 | +0.14% | 0.0008 |
| 2020-2022 2020-01-01 → 2023-01-01 | 135,952 | -0.05% | 0.3033 | +0.06% | 0.2253 | -0.23% | <0.001 |
| 2023-2026 2023-01-01 → 2099-01-01 | 161,576 | -0.43% | <0.001 | -0.45% | <0.001 | +0.16% | 0.0005 |
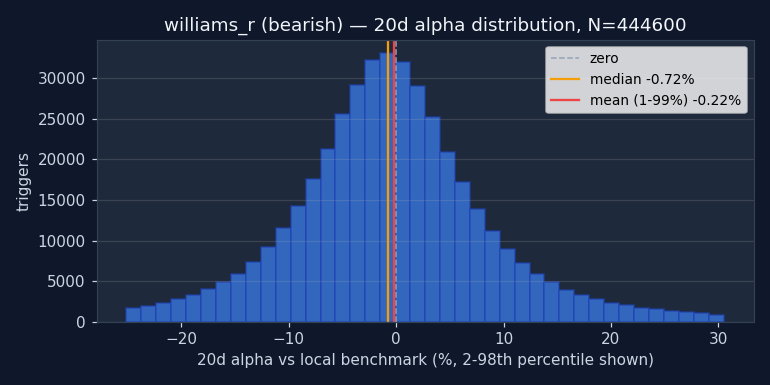
↓ Bearish triggers negative alpha = signal was right (stock underperformed market)
| Bench | Metric | 1d | 5d | 20d | 60d | 252d |
|---|---|---|---|---|---|---|
| spx | Stock % | -0.02% | +0.19% | +0.70% | +2.34% | +11.18% |
| Bench % | +0.01% | +0.22% | +0.97% | +2.94% | +13.29% | |
| Alpha % | -0.03% | -0.02% | -0.22% | -0.58% | -2.10% | |
| Median alpha | -0.02% | -0.15% | -0.72% | -1.90% | -8.33% | |
| Hit rate (α>0) | 49.3% | 48.3% | 46.2% | 44.6% | 39.5% | |
| p (naive) | <0.001 | 0.0086 | <0.001 | <0.001 | <0.001 | |
| p (HAC) | <0.001 | 0.0156 | <0.001 | <0.001 | <0.001 | |
| N | 449,514 | 447,880 | 444,600 | 437,099 | 391,254 | |
| msci | Stock % | -0.02% | +0.19% | +0.70% | +2.34% | +11.18% |
| Bench % | +0.01% | +0.18% | +0.82% | +2.46% | +10.74% | |
| Alpha % | -0.03% | +0.02% | -0.06% | -0.07% | +0.45% | |
| Median alpha | -0.03% | -0.11% | -0.55% | -1.37% | -5.70% | |
| Hit rate (α>0) | 49.3% | 48.8% | 47.0% | 46.0% | 42.7% | |
| p (naive) | <0.001 | 0.0416 | 0.0004 | 0.0193 | <0.001 | |
| p (HAC) | <0.001 | 0.0603 | 0.0219 | 0.2914 | 0.1395 | |
| N | 448,141 | 446,064 | 442,737 | 434,282 | 389,070 | |
| spxew | Stock % | -0.02% | +0.19% | +0.70% | +2.34% | +11.18% |
| Bench % | +0.03% | +0.21% | +0.79% | +2.21% | +9.67% | |
| Alpha % | -0.05% | -0.02% | -0.01% | +0.17% | +1.67% | |
| Median alpha | -0.04% | -0.12% | -0.46% | -1.12% | -4.68% | |
| Hit rate (α>0) | 49.0% | 48.6% | 47.4% | 46.7% | 43.7% | |
| p (naive) | <0.001 | 0.0313 | 0.4383 | <0.001 | <0.001 | |
| p (HAC) | <0.001 | 0.0477 | 0.6137 | 0.0102 | <0.001 | |
| N | 447,600 | 443,877 | 441,386 | 433,885 | 387,212 |
Permutation null detail — all horizons × both benchmarks
| Horizon | Bench | Observed α | Null mean | Null 95% CI | pperm |
|---|---|---|---|---|---|
| 1d | spx | -0.03% | -0.00% | [-0.02%, +0.17%] | 0.005 |
| 1d | msci | -0.03% | -0.03% | [-0.04%, +0.15%] | 0.935 |
| 1d | spxew | -0.05% | -0.03% | [-0.04%, +0.15%] | 0.005 |
| 5d | spx | -0.02% | +0.11% | [+0.01%, +0.36%] | 0.005 |
| 5d | msci | +0.02% | +0.11% | [+0.01%, +0.37%] | 0.035 |
| 5d | spxew | -0.02% | +0.13% | [+0.04%, +0.39%] | 0.005 |
| 20d | spx | -0.22% | +0.24% | [+0.12%, +0.50%] | 0.005 |
| 20d | msci | -0.06% | +0.37% | [+0.24%, +0.62%] | 0.005 |
| 20d | spxew | -0.01% | +0.44% | [+0.31%, +0.69%] | 0.005 |
| 60d | spx | -0.58% | +0.54% | [+0.37%, +0.86%] | 0.005 |
| 60d | msci | -0.07% | +0.98% | [+0.81%, +1.30%] | 0.005 |
| 60d | spxew | +0.17% | +1.21% | [+1.04%, +1.53%] | 0.005 |
| 252d | spx | -2.10% | +1.53% | [+1.21%, +1.86%] | 0.005 |
| 252d | msci | +0.45% | +3.85% | [+3.55%, +4.20%] | 0.005 |
| 252d | spxew | +1.67% | +5.20% | [+4.87%, +5.54%] | 0.005 |
Example triggers on US large-caps (2023+, mcap ≥ $30B)
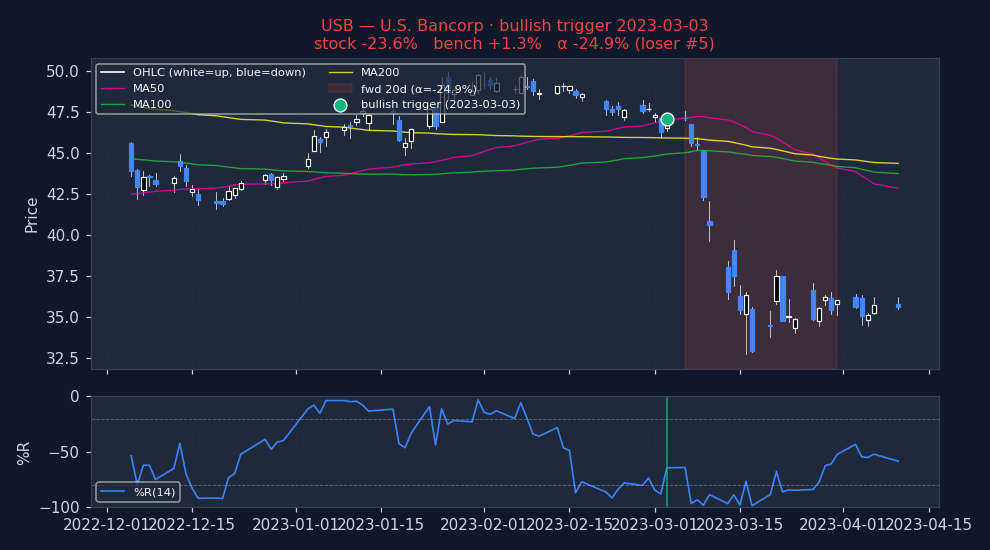
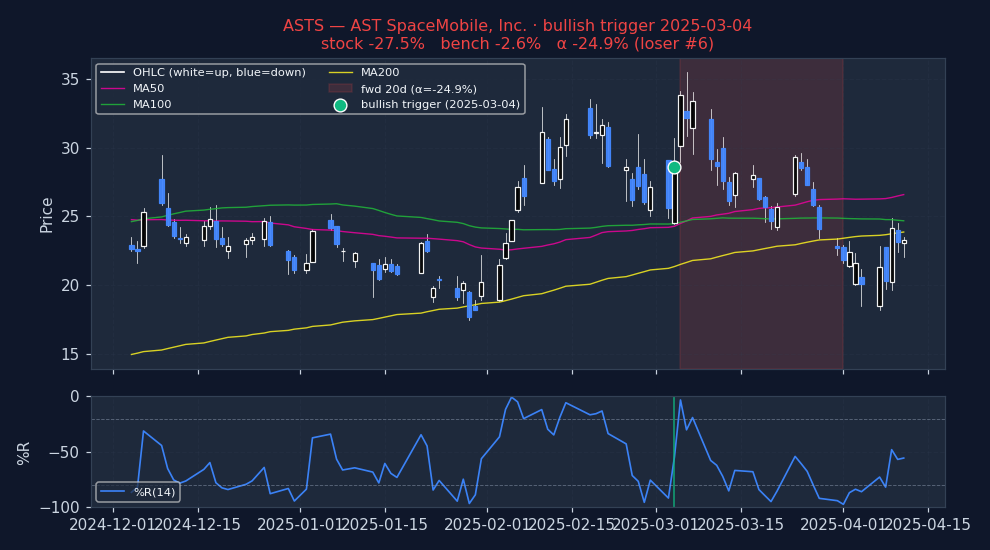
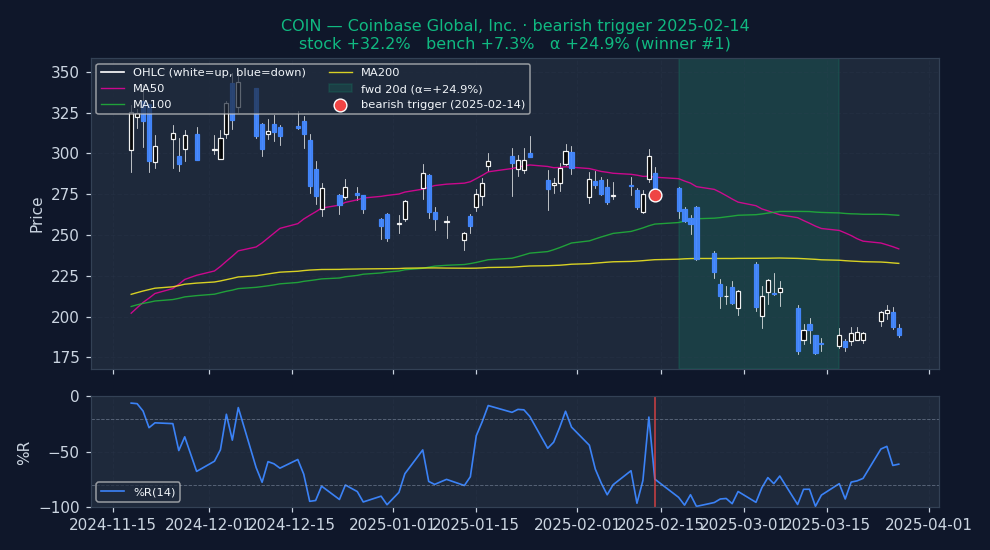
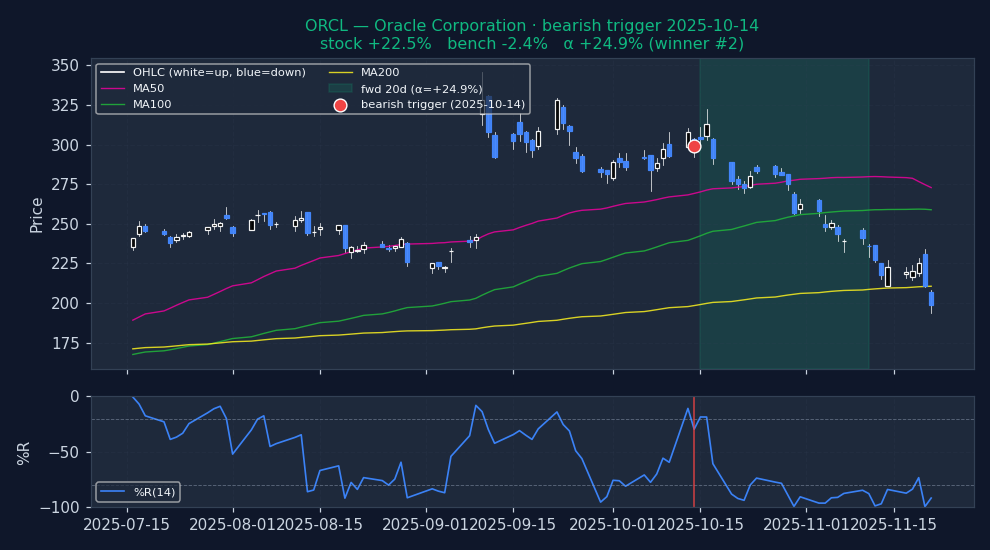
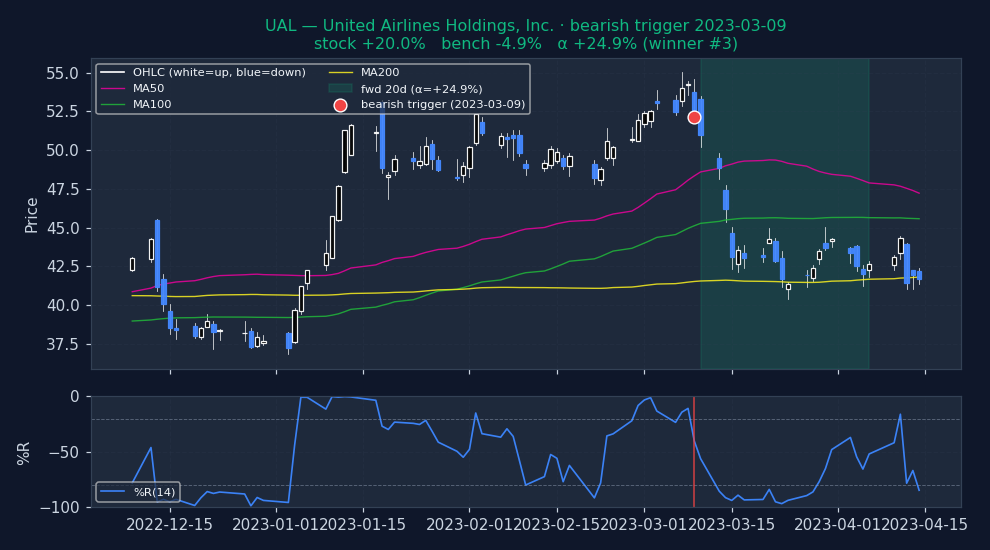
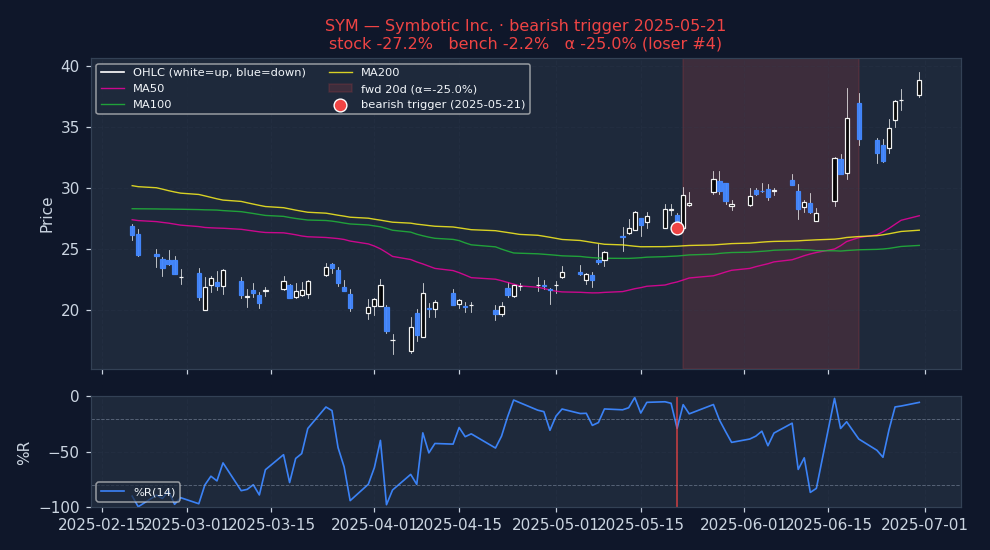
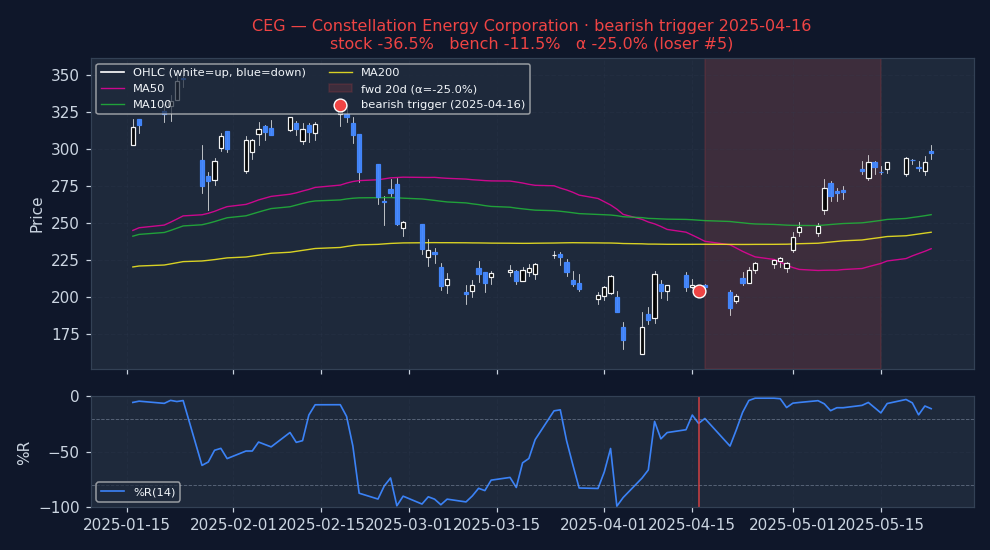
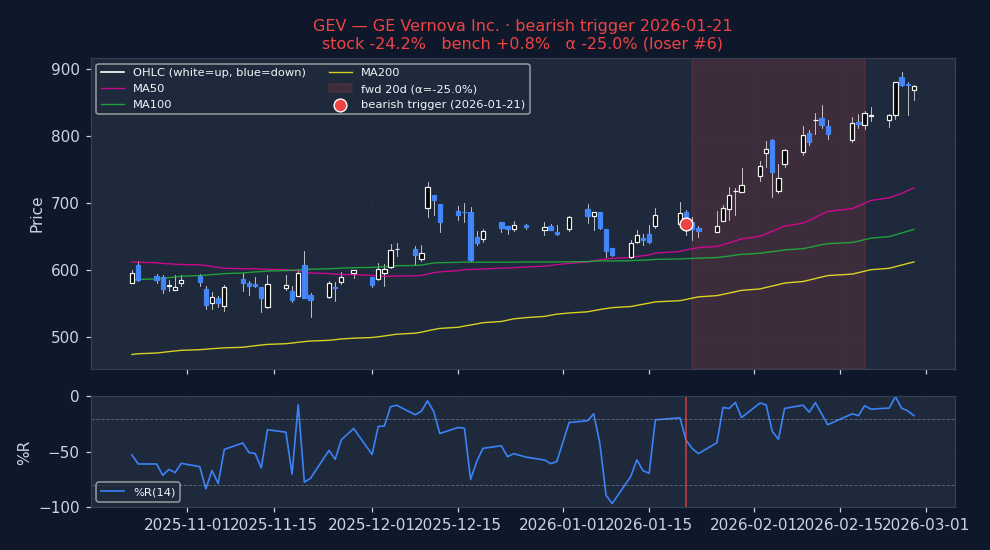
Six recent bearish WILLIAMS_R triggers on US mega-caps, filtered to |alpha| ≤ 25% to exclude catalyst-driven outliers (earnings surprises, M&A, binary events). The first three are the strongest outcomes — what the signal looks like when it works. The last three are the weakest — what the signal looks like when it fails. Each chart shows the stock's price with signal-appropriate technical overlays (e.g. MACD subpanel on MACD pages, Bollinger Bands on Bollinger pages, the 52-week trailing max line on 52w-high pages), a dot marking the trigger date, and the forward window shaded (green when the signal was right, red when it wasn't). Click any chart to open full-size.
Strongest outcomes (what WILLIAMS_R looks like when it works)
Weakest outcomes (what WILLIAMS_R looks like when it fails)
Stock-regime quadrants (2×2 per-stock, 20d alpha detail table)
| Quadrant | N | Stock % (spx) | Bench % (spx) | Alpha % (spx) | p (HAC) | Stock % (msci) | Bench % (msci) | Alpha % (msci) | p (HAC) | Stock % (spxew) | Bench % (spxew) | Alpha % (spxew) | p (HAC) |
|---|---|---|---|---|---|---|---|---|---|---|---|---|---|
| Trending + Low vol Clean directional grind, low whipsaw | 39,171 | +0.17% | +0.50% | -0.28% | <0.001 | +0.17% | +0.30% | -0.07% | 0.0843 | +0.17% | +0.17% | +0.07% | 0.0661 |
| Trending + High vol Crisis selloff or parabolic rally | 146,088 | +0.82% | +1.09% | -0.22% | <0.001 | +0.82% | +0.96% | -0.06% | 0.2592 | +0.82% | +0.88% | +0.03% | 0.6108 |
| Non-trending + Low vol Quiet chop, summer doldrums | 52,590 | +0.21% | +0.66% | -0.43% | <0.001 | +0.21% | +0.42% | -0.19% | <0.001 | +0.21% | +0.35% | -0.10% | 0.0025 |
| Non-trending + High vol Classical "whipsaw zone" for momentum | 211,810 | +0.91% | +1.06% | -0.10% | 0.0079 | +0.91% | +0.94% | +0.04% | 0.2876 | +0.91% | +0.95% | +0.03% | 0.4190 |
Sub-period breakdown table (20d alpha)
| Period | N | Alpha % (spx) | p (HAC) | Alpha % (msci) | p (HAC) | Alpha % (spxew) | p (HAC) |
|---|---|---|---|---|---|---|---|
| 2015-2019 2015-01-01 → 2020-01-01 | 136,162 | -0.36% | <0.001 | -0.15% | <0.001 | -0.09% | 0.0107 |
| 2020-2022 2020-01-01 → 2023-01-01 | 141,552 | +0.13% | 0.0072 | +0.29% | <0.001 | -0.10% | 0.0397 |
| 2023-2026 2023-01-01 → 2099-01-01 | 171,954 | -0.38% | <0.001 | -0.24% | <0.001 | +0.16% | 0.0006 |
Methodology and caveats
How to read. Entry at open of T+1 (one trading day after the signal fires on close of T). 20d = open T+1 to close T+20. Alpha = stock return − benchmark return over the same window (Convention A, single-sided, textbook). For bullish triggers, POSITIVE alpha = signal was right. For bearish triggers, NEGATIVE alpha = signal was right (stock underperformed market). No sign-flipping; the direction of the bet determines what "good" looks like. Per-stock regime is each stock's own ADX(14) and RV(20) at the trigger date — not market-wide state.
Three p-values, three robustness tests. (a) p_naive: scipy one-sample t-test on winsorized alphas. Optimistic because overlapping 20d windows on the same ticker inflate effective N. (b) p_hac: Newey-West HAC with lag = horizon — corrects for the overlap and is the academic-finance standard. (c) p_perm: fraction of 200 random-date null iterations with mean ≥ observed. Tests whether the signal beats random date selection at all. A signal that clears all three (pnaive, phac, pperm all < 0.05) has real information; a signal that fails pperm has zero edge even if the t-test says "significant."
Caveats. (i) Universe reflects today's active tickers; delisted losers pruned → survivorship bias. (ii) Mcap ≥ $100M filter uses today's snapshot, not point-in-time — mild lookahead on which stocks enter the sample, not on returns. (iii) Means and p-values use winsorized alphas (1/99 percentile) to prevent data errors from dominating. Medians and hit rates use raw data. (iv) Zero transaction costs assumed. Realistic bid-ask + commissions remove 20–40bps from 20d alpha on US large-caps, more on small-cap. Sub-20bps alpha is noise in practice. (v) Past performance does not predict future results.
How to use this
1 · When to reach for this signal
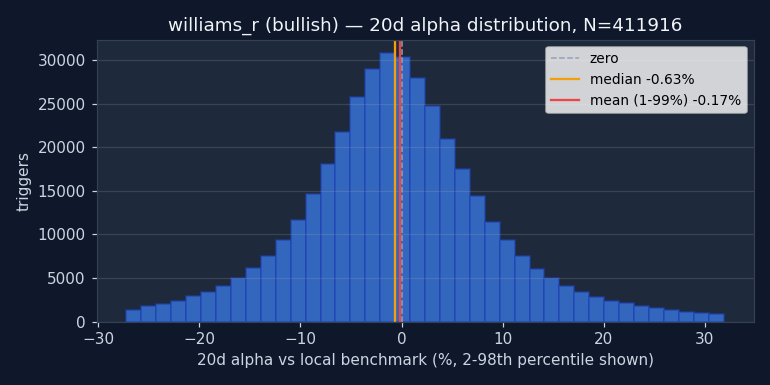
Caution recommended. Bullish 20d alpha is -0.17% and worse than random — triggering on random dates would have produced better long-side returns. Either direction fails the "beats random" test. Don't use Williams %R as a standalone entry trigger. It may still be useful as part of a composite (section 4).
2 · When it works — the setups that drive it
- Best bullish setup: Non-trending + High vol — alpha +0.07% / 20d on 210,015 historical triggers.
- Best bearish setup: Non-trending + High vol — alpha -0.10% / 20d on 211,810 historical triggers.
- Best era for bullish: 2015-2019 — alpha +0.05% / 20d.
- Best era for bearish: 2020-2022 — alpha +0.13% / 20d.
3 · When it fails — common false positives
- Weakest bullish cell: Non-trending + Low vol — alpha -0.49% / 20d on 42,864 triggers.
- Weakest bearish cell: Non-trending + Low vol — alpha -0.43% / 20d on 52,590 triggers.
- Worst era for bullish: 2023-2026 — alpha -0.43% / 20d.
- Worst era for bearish: 2023-2026 — alpha -0.38% / 20d.
Signal-specific failure patterns
4 · Pairing inside a screen
The statements below describe how this signal relates to others by construction — which indicator family it belongs to, and where same-family redundancy might reduce the independence of evidence inside a Daily Report. These are taxonomic classifications drawn from standard technical-analysis texts; they are not pairing backtests. A multi-signal convergence backtest is planned but not yet run.
Oscillator-family redundancy
Williams %R belongs to the momentum-oscillator family alongside RSI, Stochastics, and CCI — each is constructed from closing price over a short lookback, normalised to a bounded range (Murphy, Technical Analysis of the Financial Markets, 1999; Pring, Technical Analysis Explained, 5th ed. 2014; Kirkpatrick & Dahlquist, Technical Analysis, 3rd ed. 2015). Stacking two or more of these in the same direction within a single Daily Report produces correlated rather than independent evidence.
What would likely rescue this signal
This block calls out the data or conditions that could turn a technically weak signal into a usable one in a composite screen. Based on signal mechanics and the observed failure patterns above; individual combinations are not yet backtested.
- Pair with trend filter — Williams bearish alone has edge; Williams bearish + close below 50DMA (downtrend filter) would likely concentrate the alpha. Testable without new data.
- Extend holds — 60d alpha is nearly 3x the 20d alpha. Holding the full signal window captures substantially more. Time stops > price stops.
See also Why technical-only signals don't survive on their own for the broader argument.
5 · Before you act — a 5-point checklist
- Normal trading day? Rule out earnings (within ±3 days), ex-dividend, or known corporate-action dates — the signal is almost certainly reading noise, not momentum, in those windows.
- Where is price vs its own 50 / 200 DMA? A mean-reversion signal firing against the long-term trend (e.g. oversold in a clean uptrend) is much more reliable than one firing with it.
- What's the sector breadth doing? An isolated signal in a broadly down-trending sector is a lower-confidence setup than one firing with the rest of its peer group.
- Is ADV20 enough for your size? If the trigger is on a $500M name and you want to move $1M notional, you're the tape. Consider adv20d ≥ 5% of your intended position.
- What invalidates you? Define a price level (for longs: a close below the trigger-day low; for shorts: close above the trigger-day high) and honor it. The backtest alpha is an average; any one trade can be at either tail.
Execution notes
Bearish is the tradable side. 449k triggers over 2015-2026 — very large dataset. Alpha compounds from 20d to 60d (−0.22 → −0.58). Entry open T+1. Bullish Williams %R has not produced positive alpha in any horizon, any regime, any sub-period — skip.