weekly_change
Weekly Price Change
Triggers when the absolute price change over the last 5 trading days exceeds the threshold. Bullish if up, bearish if down.
Signal family
Trend — Signals that fire when price is continuing or reversing an established directional move. Momentum-following by nature.
Parameters
| Name | Description | Default | Range |
|---|---|---|---|
| threshold_pct | Minimum absolute change (%) | 10 | 1–50 |
Historical context
657,140 valid triggers on 3,455 distinct tickers between 2015-01-12 and 2026-04-22. Universe: us_only · mcap ≥ $100,000,000 · price ≥ $1 (3,455 tickers). Entry at open T+1. 1d = intraday T+1; 20d = open T+1 to close T+20.
Benchmarks: spxew (S&P 500 Equal Weight — the primary benchmark here; a median-stock view that avoids the 2020+ megacap-concentration distortion), spx (S&P 500, cap-weighted), and msci (MSCI World USD). Per-stock regime: trending = ADX(14) ≥ 25, high vol = 20d ann. vol ≥ 20%.
At a glance (20d alpha vs S&P 500 Equal Weight, US-only)
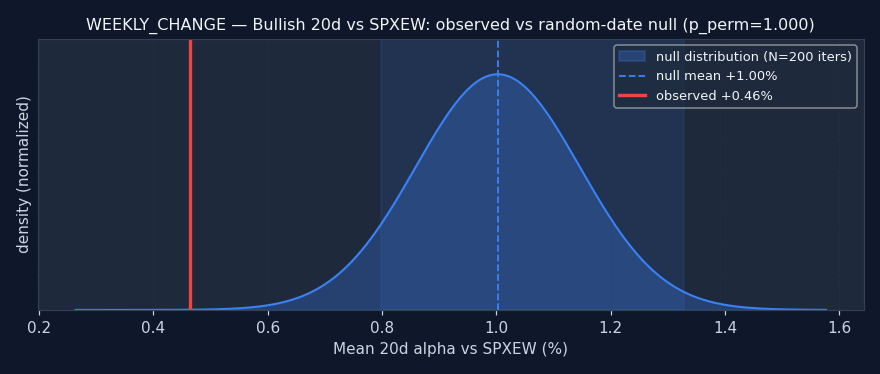
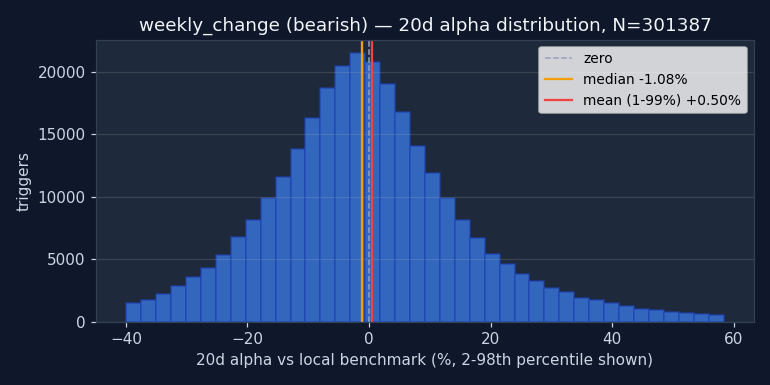
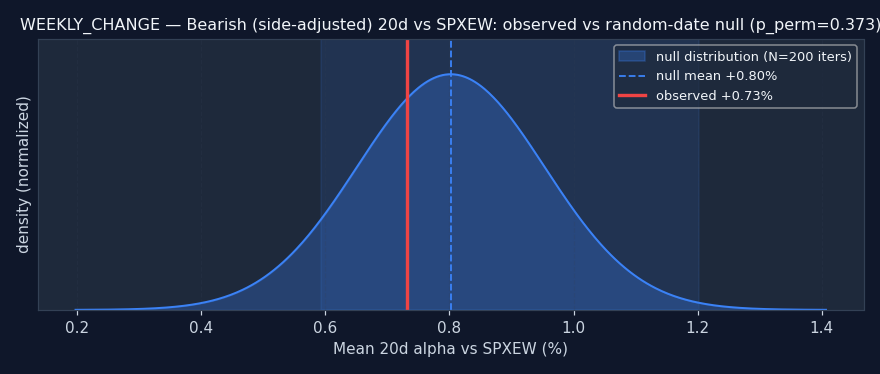
Reading this: the random-date null is: for each ticker, sample N random dates and compute the same alpha — what alpha does a signal with no information produce? If the signal's observed alpha beats the null (pperm≤0.05), it's adding real information. If it's inside or worse than the null, the signal doesn't add value over random firing — any observed alpha is either noise or a universe artifact.
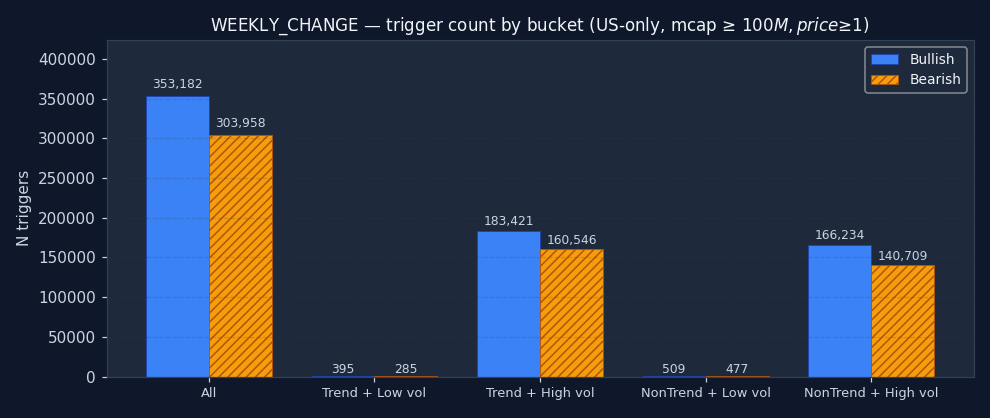
How often does WEEKLY_CHANGE fire in each regime?
The signal's bucket distribution is itself informative. If 50%+ of all WEEKLY_CHANGE triggers fire in the "non-trending + high vol" quadrant, the signal is structurally a chop-market event — regardless of what its textbook definition claims. Bullish and bearish are shown separately; counts are across the full US-only sample after the mcap and price floor.
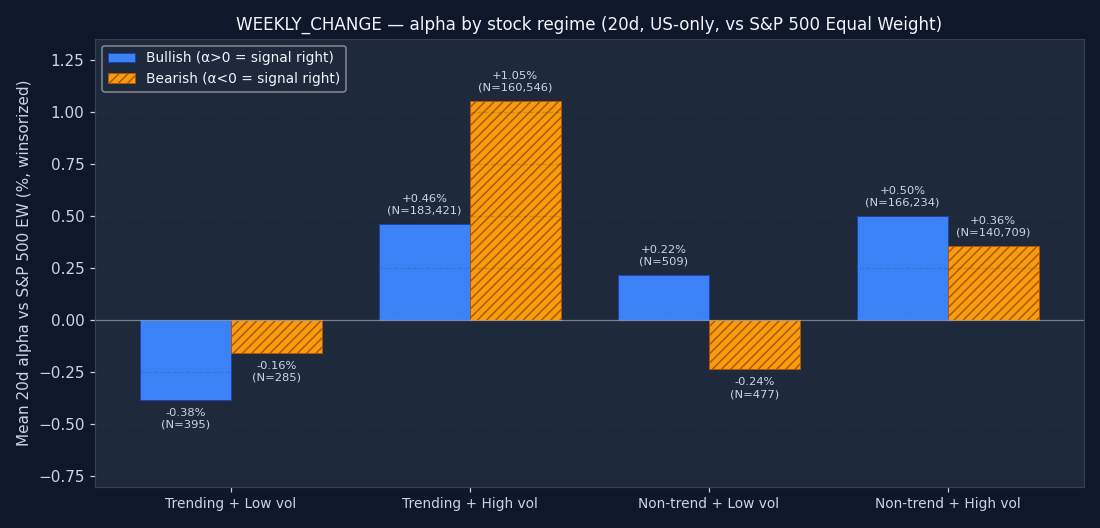
Per-stock regime quadrant — 20d alpha
Each trigger is tagged with the host stock's own technical regime on the trigger date: is the stock itself in a trend (ADX(14) ≥ 25) or ranging? And is its realized 20-day volatility high (≥ 20% annualized) or low? This is the textbook conditioning variable — "does this signal work better in trending stocks?" — answered at the level of the individual stock, not the market. Positive bars are good for the signal; negative bars mean alpha vanishes into the benchmark or worse.
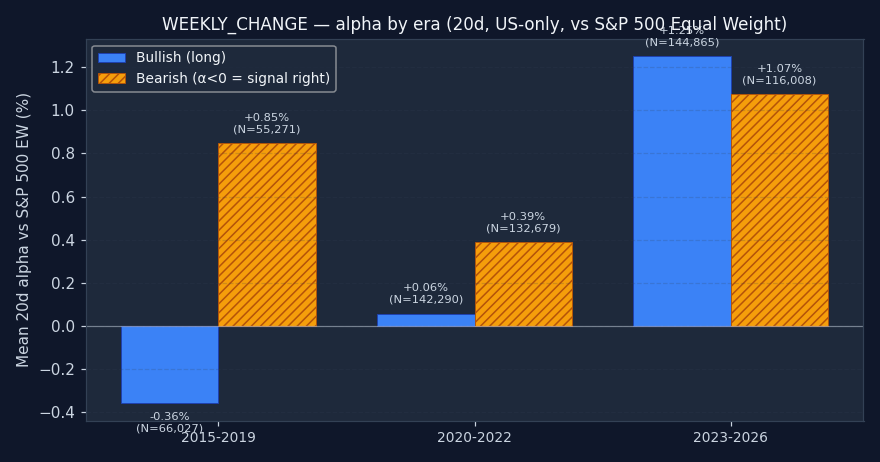
Sub-period check — does the signal work in every era?
A multi-year average can hide major instability. We split the sample into three non-overlapping windows: 2015–2019 (pre-COVID, normalized monetary policy), 2020–2022 (pandemic crash + recovery + rate-shock bear), and 2023+ (post-ZIRP, AI megacap rally). If a signal's alpha is positive overall but comes entirely from one era, that's a red flag — the conditions that produced it may not repeat. A robust signal shows a consistent sign across all non-empty buckets.
↑ Bullish triggers
| Bench | Metric | 1d | 5d | 20d | 60d | 252d |
|---|---|---|---|---|---|---|
| spx | Stock % | -0.11% | -0.03% | +1.75% | +5.83% | +27.25% |
| Bench % | +0.03% | +0.27% | +1.48% | +4.16% | +17.39% | |
| Alpha % | -0.14% | -0.29% | +0.31% | +1.69% | +9.87% | |
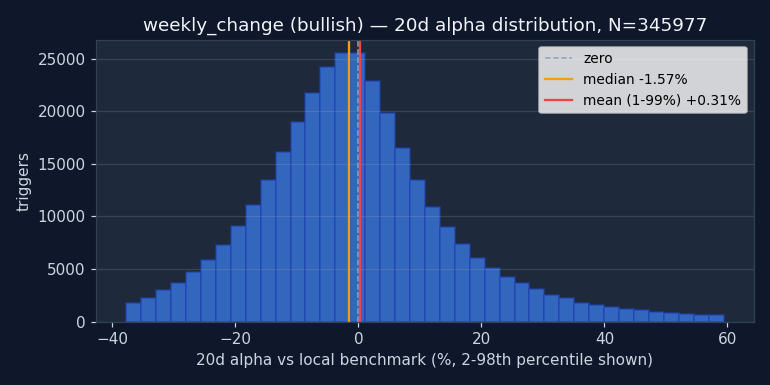
| Median alpha | -0.20% | -0.73% | -1.57% | -3.64% | -10.28% | |
| Hit rate (α>0) | 46.8% | 45.5% | 45.2% | 44.0% | 42.2% | |
| p (naive) | <0.001 | <0.001 | <0.001 | <0.001 | <0.001 | |
| p (HAC) | <0.001 | <0.001 | 0.0001 | <0.001 | <0.001 | |
| N | 352,942 | 350,379 | 345,977 | 339,573 | 300,453 | |
| msci | Stock % | -0.11% | -0.03% | +1.75% | +5.83% | +27.25% |
| Bench % | +0.07% | +0.27% | +1.37% | +3.85% | +15.23% | |
| Alpha % | -0.19% | -0.32% | +0.44% | +2.06% | +11.98% | |
| Median alpha | -0.24% | -0.75% | -1.49% | -3.28% | -8.19% | |
| Hit rate (α>0) | 46.4% | 45.3% | 45.5% | 44.6% | 43.7% | |
| p (naive) | <0.001 | <0.001 | <0.001 | <0.001 | <0.001 | |
| p (HAC) | <0.001 | <0.001 | <0.001 | <0.001 | <0.001 | |
| N | 350,657 | 348,157 | 343,862 | 337,653 | 297,847 | |
| spxew | Stock % | -0.11% | -0.03% | +1.75% | +5.83% | +27.25% |
| Bench % | +0.05% | +0.21% | +1.35% | +3.58% | +15.04% | |
| Alpha % | -0.17% | -0.25% | +0.46% | +2.30% | +12.39% | |
| Median alpha | -0.22% | -0.67% | -1.41% | -2.97% | -7.52% | |
| Hit rate (α>0) | 46.8% | 45.7% | 45.6% | 45.0% | 44.1% | |
| p (naive) | <0.001 | <0.001 | <0.001 | <0.001 | <0.001 | |
| p (HAC) | <0.001 | <0.001 | <0.001 | <0.001 | <0.001 | |
| N | 352,043 | 348,258 | 343,852 | 337,263 | 298,825 |
Permutation null detail — all horizons × both benchmarks
| Horizon | Bench | Observed α | Null mean | Null 95% CI | pperm |
|---|---|---|---|---|---|
| 1d | spx | -0.14% | -0.02% | [-0.05%, +0.20%] | 1.000 |
| 1d | msci | -0.19% | -0.04% | [-0.07%, +0.18%] | 1.000 |
| 1d | spxew | -0.17% | -0.04% | [-0.07%, +0.18%] | 1.000 |
| 5d | spx | -0.29% | +0.26% | [+0.11%, +0.56%] | 1.000 |
| 5d | msci | -0.32% | +0.27% | [+0.11%, +0.57%] | 1.000 |
| 5d | spxew | -0.25% | +0.29% | [+0.13%, +0.60%] | 1.000 |
| 20d | spx | +0.31% | +0.80% | [+0.60%, +1.12%] | 1.000 |
| 20d | msci | +0.44% | +0.93% | [+0.72%, +1.25%] | 1.000 |
| 20d | spxew | +0.46% | +1.00% | [+0.80%, +1.33%] | 1.000 |
| 60d | spx | +1.69% | +2.28% | [+1.99%, +2.67%] | 1.000 |
| 60d | msci | +2.06% | +2.74% | [+2.45%, +3.12%] | 1.000 |
| 60d | spxew | +2.30% | +2.98% | [+2.70%, +3.38%] | 1.000 |
| 252d | spx | +9.87% | +8.85% | [+8.29%, +9.44%] | 0.005 |
| 252d | msci | +11.98% | +11.10% | [+10.53%, +11.69%] | 0.005 |
| 252d | spxew | +12.39% | +12.74% | [+12.17%, +13.32%] | 0.861 |
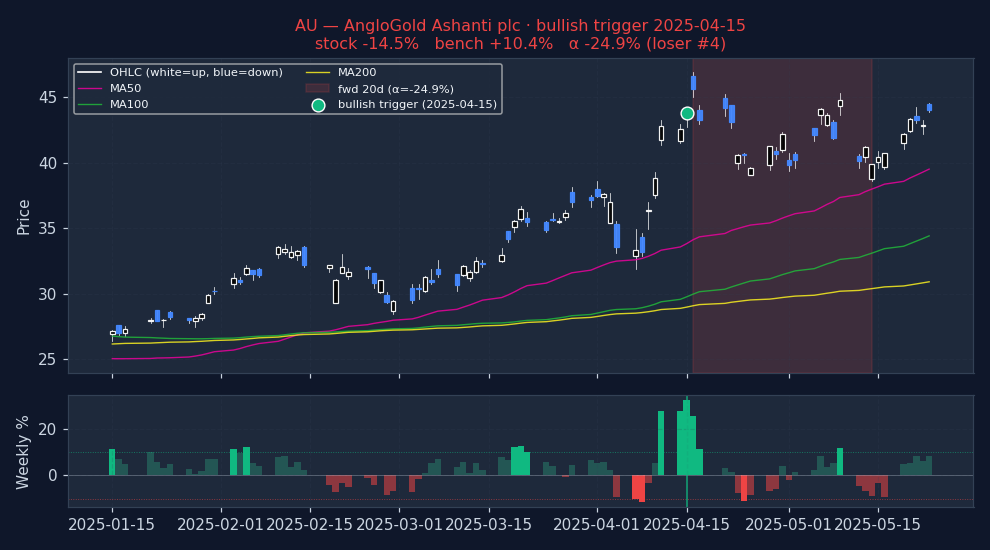
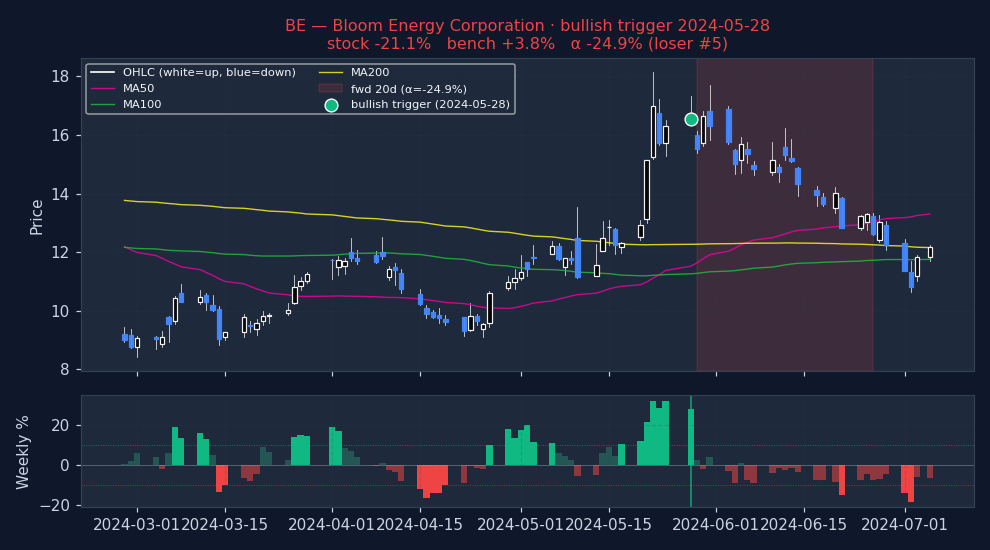
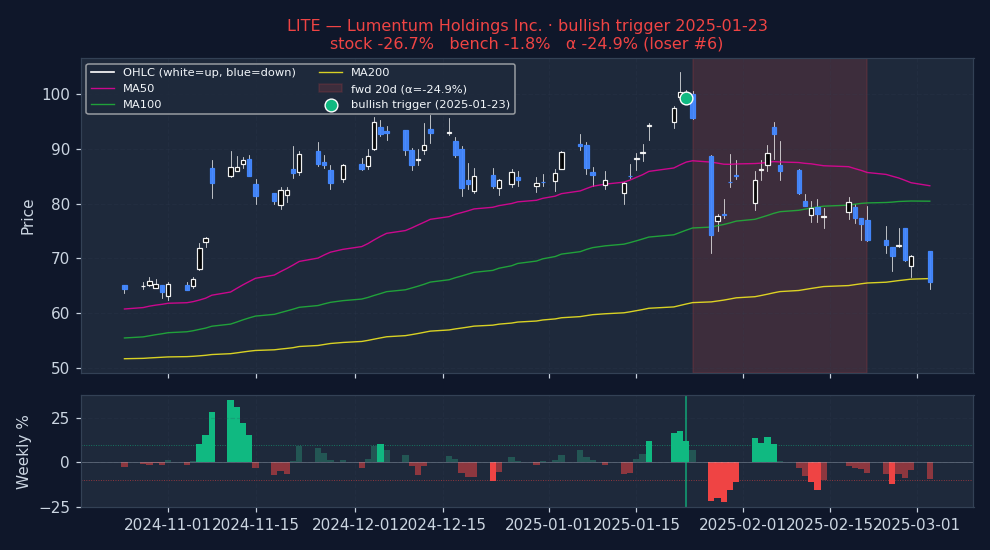
Example triggers on US large-caps (2023+, mcap ≥ $30B)
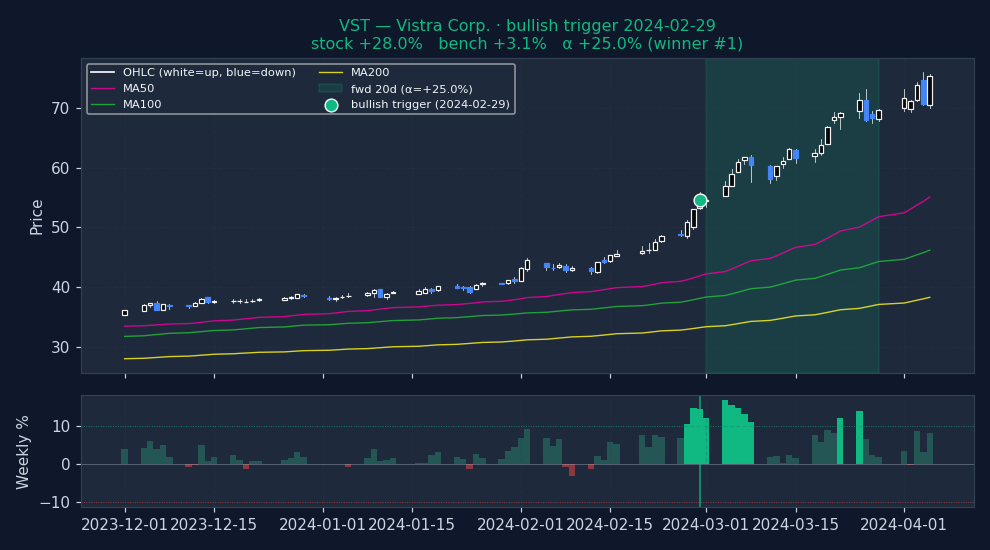
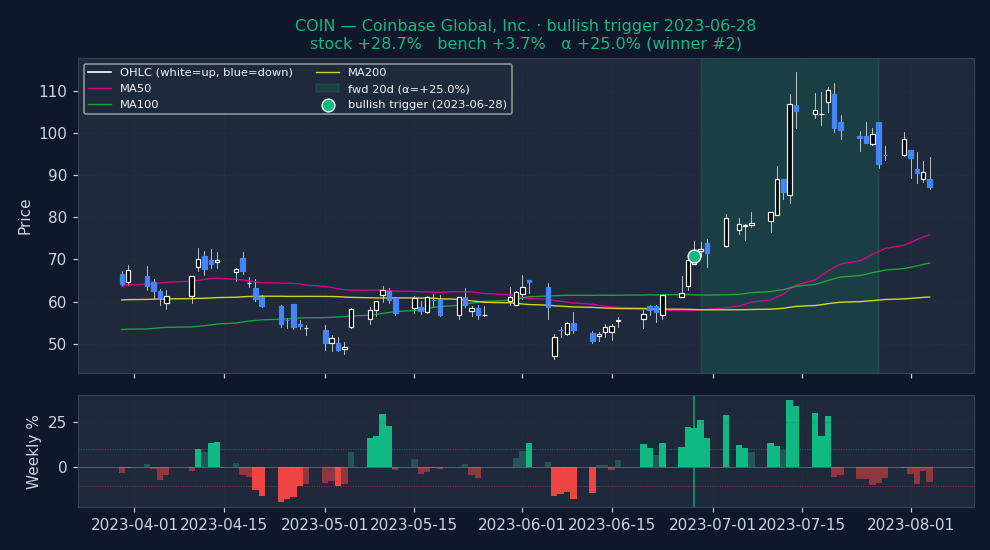
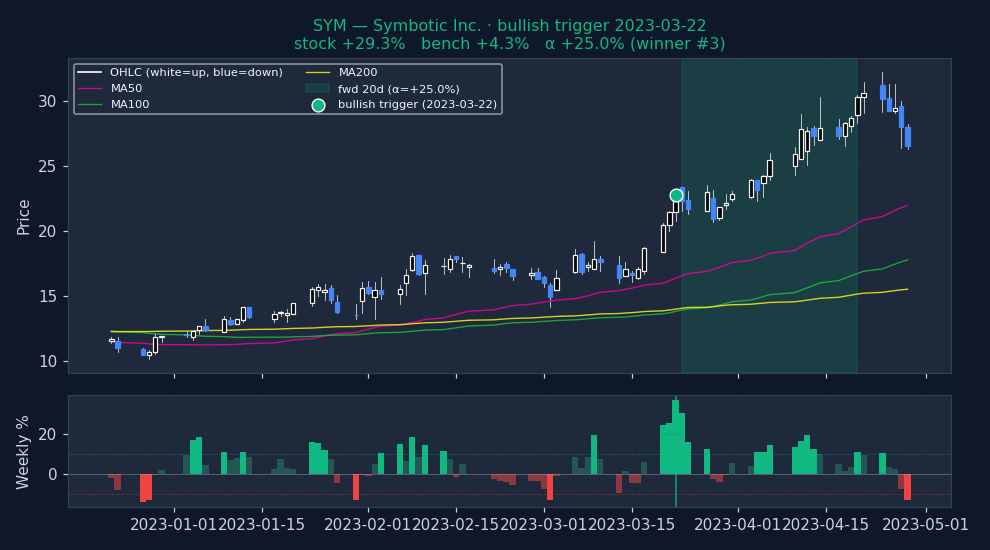
Six recent bullish WEEKLY_CHANGE triggers on US mega-caps, filtered to |alpha| ≤ 25% to exclude catalyst-driven outliers (earnings surprises, M&A, binary events). The first three are the strongest outcomes — what the signal looks like when it works. The last three are the weakest — what the signal looks like when it fails. Each chart shows the stock's price with signal-appropriate technical overlays (e.g. MACD subpanel on MACD pages, Bollinger Bands on Bollinger pages, the 52-week trailing max line on 52w-high pages), a dot marking the trigger date, and the forward window shaded (green when the signal was right, red when it wasn't). Click any chart to open full-size.
Strongest outcomes (what WEEKLY_CHANGE looks like when it works)
Weakest outcomes (what WEEKLY_CHANGE looks like when it fails)
Stock-regime quadrants (2×2 per-stock, 20d alpha detail table)
| Quadrant | N | Stock % (spx) | Bench % (spx) | Alpha % (spx) | p (HAC) | Stock % (msci) | Bench % (msci) | Alpha % (msci) | p (HAC) | Stock % (spxew) | Bench % (spxew) | Alpha % (spxew) | p (HAC) |
|---|---|---|---|---|---|---|---|---|---|---|---|---|---|
| Trending + Low vol Clean directional grind, low whipsaw | 395 | +0.04% | +0.77% | -0.73% | 0.1176 | +0.04% | +0.53% | -0.46% | 0.3287 | +0.04% | +0.43% | -0.38% | 0.4231 |
| Trending + High vol Crisis selloff or parabolic rally | 183,421 | +1.86% | +1.64% | +0.26% | 0.0301 | +1.86% | +1.46% | +0.47% | 0.0001 | +1.86% | +1.48% | +0.46% | 0.0001 |
| Non-trending + Low vol Quiet chop, summer doldrums | 509 | +0.96% | +1.26% | -0.29% | 0.4841 | +0.96% | +1.05% | -0.07% | 0.8592 | +0.96% | +0.78% | +0.22% | 0.5802 |
| Non-trending + High vol Classical "whipsaw zone" for momentum | 166,234 | +1.68% | +1.30% | +0.41% | <0.001 | +1.68% | +1.28% | +0.45% | <0.001 | +1.68% | +1.22% | +0.50% | <0.001 |
Sub-period breakdown table (20d alpha)
| Period | N | Alpha % (spx) | p (HAC) | Alpha % (msci) | p (HAC) | Alpha % (spxew) | p (HAC) |
|---|---|---|---|---|---|---|---|
| 2015-2019 2015-01-01 → 2020-01-01 | 66,027 | -0.57% | 0.0004 | -0.39% | 0.0168 | -0.36% | 0.0281 |
| 2020-2022 2020-01-01 → 2023-01-01 | 142,290 | +0.28% | 0.0291 | +0.40% | 0.0019 | +0.06% | 0.6525 |
| 2023-2026 2023-01-01 → 2099-01-01 | 144,865 | +0.76% | <0.001 | +0.86% | <0.001 | +1.25% | <0.001 |
↓ Bearish triggers negative alpha = signal was right (stock underperformed market)
| Bench | Metric | 1d | 5d | 20d | 60d | 252d |
|---|---|---|---|---|---|---|
| spx | Stock % | +0.07% | +0.59% | +2.41% | +8.03% | +31.04% |
| Bench % | +0.08% | +0.42% | +1.92% | +5.43% | +18.30% | |
| Alpha % | -0.03% | +0.19% | +0.50% | +2.59% | +12.72% | |
| Median alpha | -0.12% | -0.36% | -1.08% | -2.73% | -10.48% | |
| Hit rate (α>0) | 48.3% | 47.9% | 46.8% | 45.6% | 42.6% | |
| p (naive) | 0.0001 | <0.001 | <0.001 | <0.001 | <0.001 | |
| p (HAC) | 0.0001 | <0.001 | <0.001 | <0.001 | <0.001 | |
| N | 303,831 | 303,521 | 301,387 | 292,562 | 270,453 | |
| msci | Stock % | +0.07% | +0.59% | +2.41% | +8.03% | +31.04% |
| Bench % | +0.01% | +0.33% | +1.82% | +5.12% | +16.67% | |
| Alpha % | +0.04% | +0.24% | +0.66% | +2.97% | +14.33% | |
| Median alpha | -0.11% | -0.31% | -0.96% | -2.33% | -8.81% | |
| Hit rate (α>0) | 48.5% | 48.2% | 47.2% | 46.2% | 43.6% | |
| p (naive) | <0.001 | <0.001 | <0.001 | <0.001 | <0.001 | |
| p (HAC) | <0.001 | <0.001 | <0.001 | <0.001 | <0.001 | |
| N | 303,186 | 301,536 | 299,617 | 290,816 | 269,066 | |
| spxew | Stock % | +0.07% | +0.59% | +2.41% | +8.03% | +31.04% |
| Bench % | +0.11% | +0.28% | +1.68% | +5.12% | +16.13% | |
| Alpha % | -0.05% | +0.31% | +0.73% | +2.88% | +15.04% | |
| Median alpha | -0.15% | -0.25% | -0.90% | -2.31% | -7.75% | |
| Hit rate (α>0) | 47.9% | 48.6% | 47.4% | 46.2% | 44.3% | |
| p (naive) | <0.001 | <0.001 | <0.001 | <0.001 | <0.001 | |
| p (HAC) | <0.001 | <0.001 | <0.001 | <0.001 | <0.001 | |
| N | 302,454 | 301,344 | 298,755 | 290,529 | 268,299 |
Permutation null detail — all horizons × both benchmarks
| Horizon | Bench | Observed α | Null mean | Null 95% CI | pperm |
|---|---|---|---|---|---|
| 1d | spx | -0.03% | -0.03% | [-0.07%, +0.22%] | 0.925 |
| 1d | msci | +0.04% | -0.06% | [-0.09%, +0.20%] | 0.940 |
| 1d | spxew | -0.05% | -0.06% | [-0.09%, +0.20%] | 0.940 |
| 5d | spx | +0.19% | +0.20% | [+0.04%, +0.54%] | 0.622 |
| 5d | msci | +0.24% | +0.20% | [+0.04%, +0.54%] | 0.701 |
| 5d | spxew | +0.31% | +0.22% | [+0.06%, +0.56%] | 0.796 |
| 20d | spx | +0.50% | +0.60% | [+0.39%, +0.99%] | 0.269 |
| 20d | msci | +0.66% | +0.73% | [+0.51%, +1.10%] | 0.408 |
| 20d | spxew | +0.73% | +0.80% | [+0.59%, +1.20%] | 0.373 |
| 60d | spx | +2.59% | +1.70% | [+1.39%, +2.21%] | 1.000 |
| 60d | msci | +2.97% | +2.16% | [+1.85%, +2.66%] | 1.000 |
| 60d | spxew | +2.88% | +2.40% | [+2.09%, +2.90%] | 0.970 |
| 252d | spx | +12.72% | +6.20% | [+5.67%, +6.81%] | 1.000 |
| 252d | msci | +14.33% | +8.45% | [+7.92%, +9.10%] | 1.000 |
| 252d | spxew | +15.04% | +10.12% | [+9.61%, +10.73%] | 1.000 |
Example triggers on US large-caps (2023+, mcap ≥ $30B)
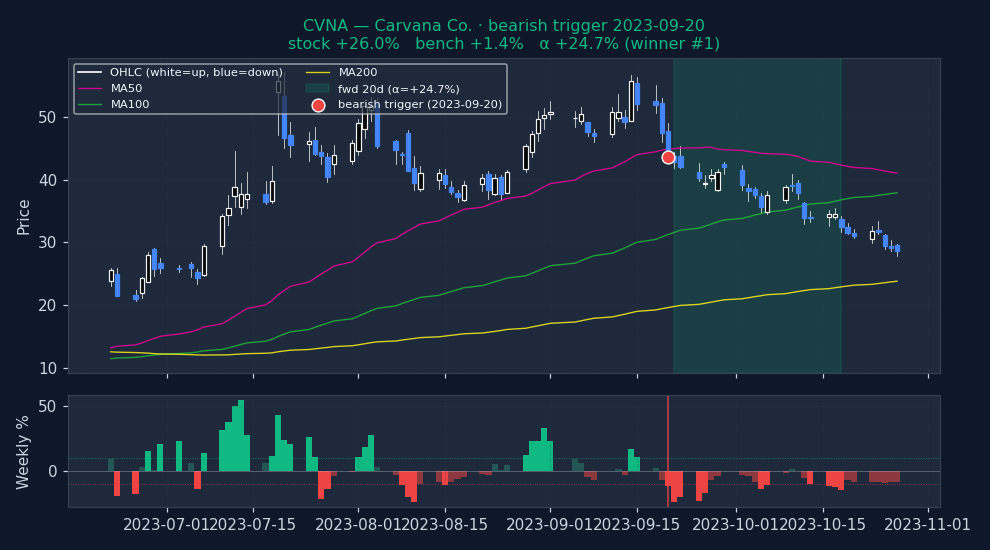
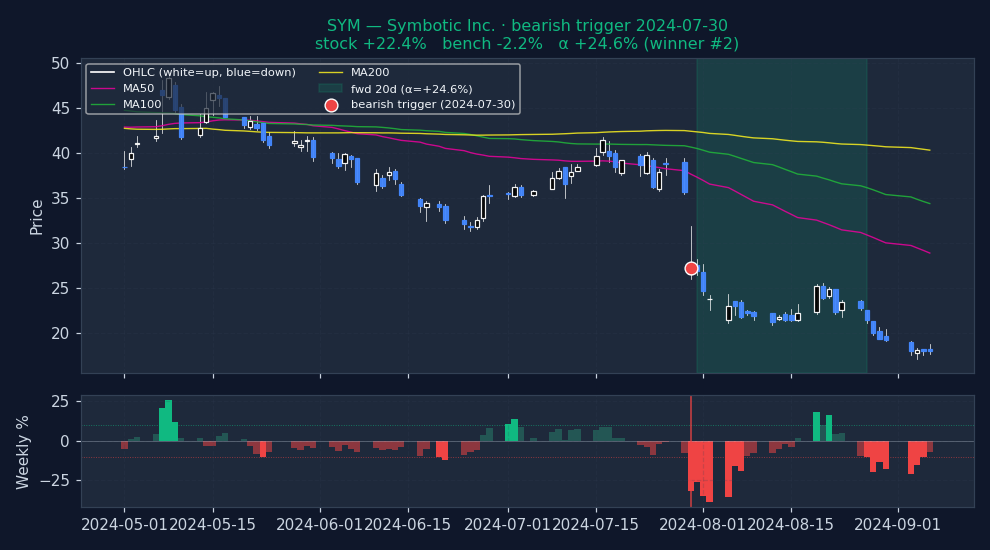
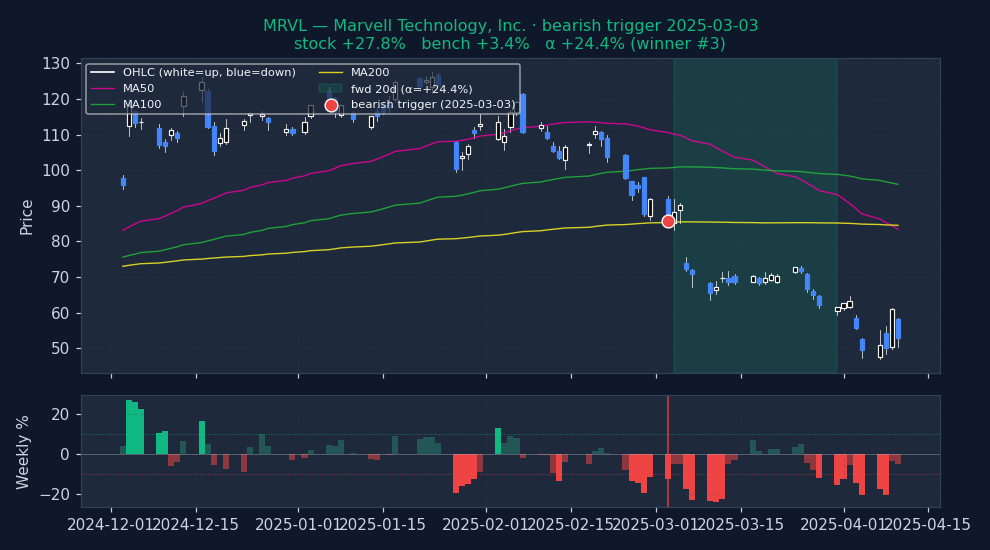
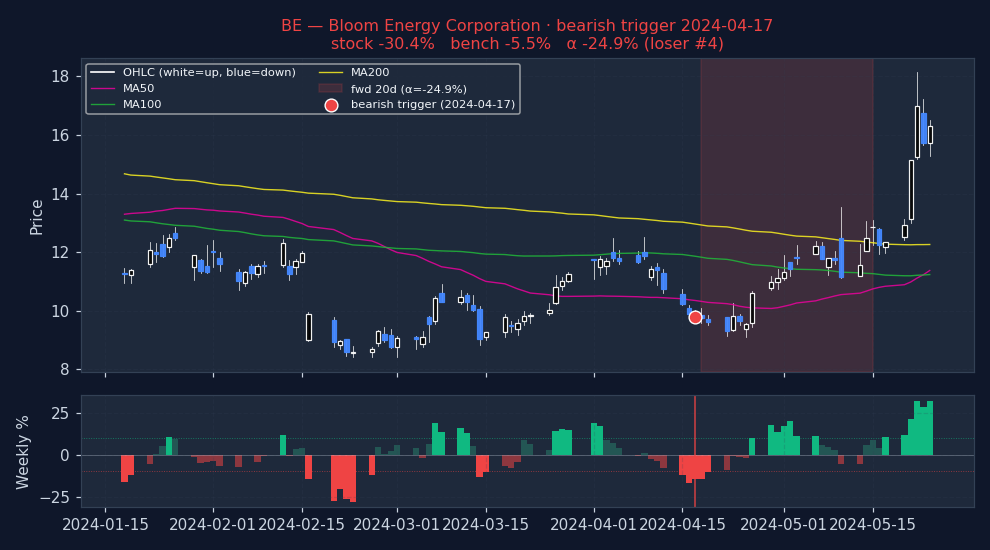
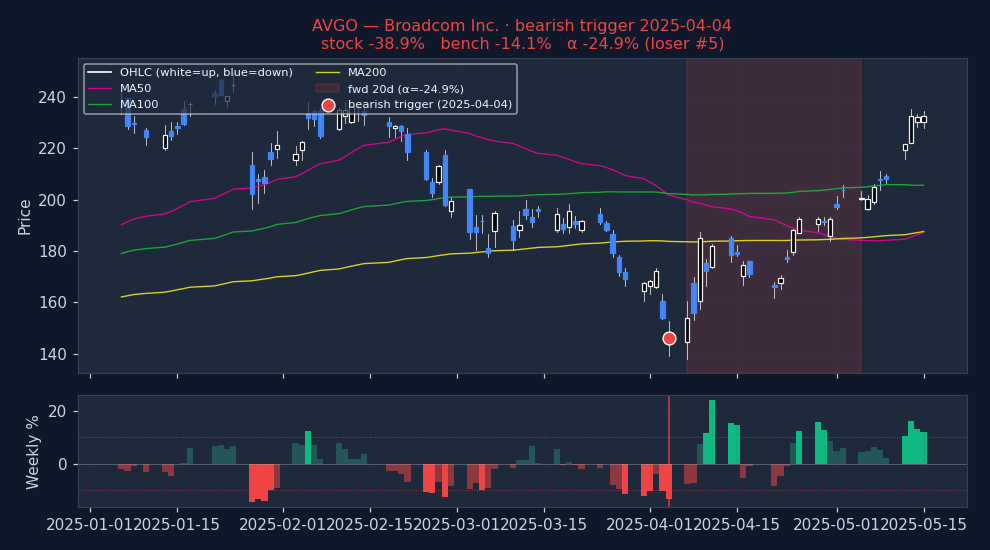
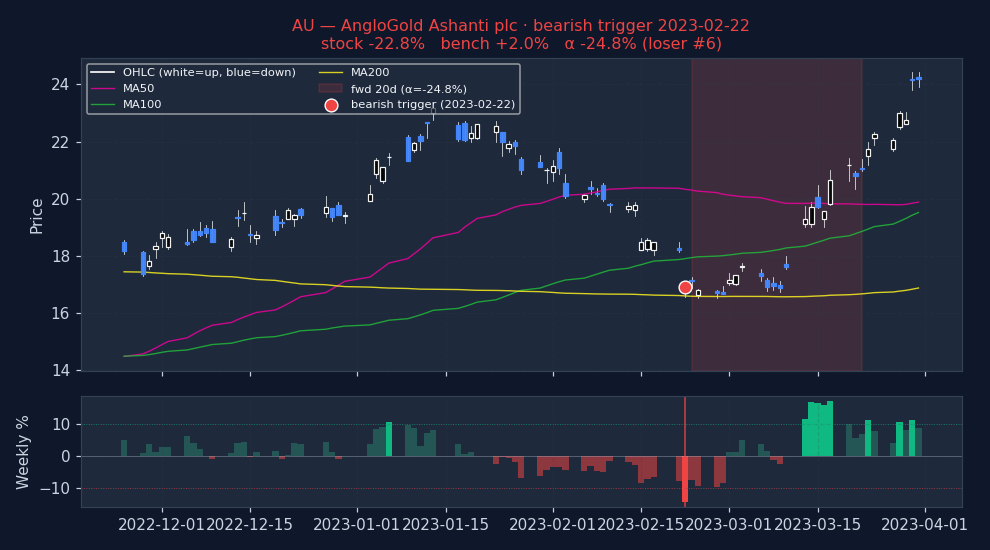
Six recent bearish WEEKLY_CHANGE triggers on US mega-caps, filtered to |alpha| ≤ 25% to exclude catalyst-driven outliers (earnings surprises, M&A, binary events). The first three are the strongest outcomes — what the signal looks like when it works. The last three are the weakest — what the signal looks like when it fails. Each chart shows the stock's price with signal-appropriate technical overlays (e.g. MACD subpanel on MACD pages, Bollinger Bands on Bollinger pages, the 52-week trailing max line on 52w-high pages), a dot marking the trigger date, and the forward window shaded (green when the signal was right, red when it wasn't). Click any chart to open full-size.
Strongest outcomes (what WEEKLY_CHANGE looks like when it works)
Weakest outcomes (what WEEKLY_CHANGE looks like when it fails)
Stock-regime quadrants (2×2 per-stock, 20d alpha detail table)
| Quadrant | N | Stock % (spx) | Bench % (spx) | Alpha % (spx) | p (HAC) | Stock % (msci) | Bench % (msci) | Alpha % (msci) | p (HAC) | Stock % (spxew) | Bench % (spxew) | Alpha % (spxew) | p (HAC) |
|---|---|---|---|---|---|---|---|---|---|---|---|---|---|
| Trending + Low vol Clean directional grind, low whipsaw | 285 | +0.36% | +0.92% | -0.48% | 0.3291 | +0.36% | +0.79% | -0.30% | 0.5301 | +0.36% | +0.66% | -0.16% | 0.7433 |
| Trending + High vol Crisis selloff or parabolic rally | 160,546 | +3.06% | +2.41% | +0.69% | <0.001 | +3.06% | +2.17% | +0.94% | <0.001 | +3.06% | +2.00% | +1.05% | <0.001 |
| Non-trending + Low vol Quiet chop, summer doldrums | 477 | +0.05% | +0.72% | -0.58% | 0.1955 | +0.05% | +0.63% | -0.47% | 0.2745 | +0.05% | +0.37% | -0.24% | 0.5601 |
| Non-trending + High vol Classical "whipsaw zone" for momentum | 140,709 | +1.67% | +1.43% | +0.28% | 0.0075 | +1.67% | +1.41% | +0.33% | 0.0014 | +1.67% | +1.33% | +0.36% | 0.0006 |
Sub-period breakdown table (20d alpha)
| Period | N | Alpha % (spx) | p (HAC) | Alpha % (msci) | p (HAC) | Alpha % (spxew) | p (HAC) |
|---|---|---|---|---|---|---|---|
| 2015-2019 2015-01-01 → 2020-01-01 | 55,271 | +0.93% | <0.001 | +1.13% | <0.001 | +0.85% | <0.001 |
| 2020-2022 2020-01-01 → 2023-01-01 | 132,679 | +0.36% | 0.0031 | +0.68% | <0.001 | +0.39% | 0.0014 |
| 2023-2026 2023-01-01 → 2099-01-01 | 116,008 | +0.47% | 0.0005 | +0.41% | 0.0022 | +1.07% | <0.001 |
Methodology and caveats
How to read. Entry at open of T+1 (one trading day after the signal fires on close of T). 20d = open T+1 to close T+20. Alpha = stock return − benchmark return over the same window (Convention A, single-sided, textbook). For bullish triggers, POSITIVE alpha = signal was right. For bearish triggers, NEGATIVE alpha = signal was right (stock underperformed market). No sign-flipping; the direction of the bet determines what "good" looks like. Per-stock regime is each stock's own ADX(14) and RV(20) at the trigger date — not market-wide state.
Three p-values, three robustness tests. (a) p_naive: scipy one-sample t-test on winsorized alphas. Optimistic because overlapping 20d windows on the same ticker inflate effective N. (b) p_hac: Newey-West HAC with lag = horizon — corrects for the overlap and is the academic-finance standard. (c) p_perm: fraction of 200 random-date null iterations with mean ≥ observed. Tests whether the signal beats random date selection at all. A signal that clears all three (pnaive, phac, pperm all < 0.05) has real information; a signal that fails pperm has zero edge even if the t-test says "significant."
Caveats. (i) Universe reflects today's active tickers; delisted losers pruned → survivorship bias. (ii) Mcap ≥ $100M filter uses today's snapshot, not point-in-time — mild lookahead on which stocks enter the sample, not on returns. (iii) Means and p-values use winsorized alphas (1/99 percentile) to prevent data errors from dominating. Medians and hit rates use raw data. (iv) Zero transaction costs assumed. Realistic bid-ask + commissions remove 20–40bps from 20d alpha on US large-caps, more on small-cap. Sub-20bps alpha is noise in practice. (v) Past performance does not predict future results.
How to use this
1 · When to reach for this signal
Caution recommended. Bullish 20d alpha is +0.31% and worse than random — triggering on random dates would have produced better long-side returns. Either direction fails the "beats random" test. Don't use Weekly Price Change as a standalone entry trigger. It may still be useful as part of a composite (section 4).
2 · When it works — the setups that drive it
- Best bullish setup: Non-trending + High vol — alpha +0.41% / 20d on 166,234 historical triggers.
- Best bearish setup: Trending + High vol — alpha +0.69% / 20d on 160,546 historical triggers.
- Best era for bullish: 2023-2026 — alpha +0.76% / 20d.
- Best era for bearish: 2015-2019 — alpha +0.93% / 20d.
3 · When it fails — common false positives
- Weakest bullish cell: Trending + Low vol — alpha -0.73% / 20d on 395 triggers.
- Weakest bearish cell: Non-trending + Low vol — alpha -0.58% / 20d on 477 triggers.
- Worst era for bullish: 2015-2019 — alpha -0.57% / 20d.
- Worst era for bearish: 2020-2022 — alpha +0.36% / 20d.
Signal-specific failure patterns
4 · Pairing inside a screen
The statements below describe how this signal relates to others by construction — which indicator family it belongs to, and where same-family redundancy might reduce the independence of evidence inside a Daily Report. These are taxonomic classifications drawn from standard technical-analysis texts; they are not pairing backtests. A multi-signal convergence backtest is planned but not yet run.
Rate-of-change family
Weekly percent change is a rate-of-change (ROC) measure of price momentum. It is related to but distinct from the range-normalised oscillator family (RSI, Stochastics, Williams %R, CCI) — ROC is unbounded while oscillators are bounded (Kirkpatrick & Dahlquist, Technical Analysis, 3rd ed. 2015). Pairing weekly_change with an oscillator in the same direction produces partially overlapping evidence rather than fully independent confirmation.
What would likely rescue this signal
This block calls out the data or conditions that could turn a technically weak signal into a usable one in a composite screen. Based on signal mechanics and the observed failure patterns above; individual combinations are not yet backtested.
- Invert the bearish side — If bearish weekly_change produces consistently positive alpha, the signal is really a BOUNCE trigger. Renaming 'weekly_change bearish' to 'weekly_drawdown_bounce_bullish' and flipping its interpretation would be honest. Requires a deliberate design decision.
- Bound the magnitude — ±5% is a pretty loose threshold. Tightening to stocks with ±15% moves might concentrate signal in catalyst-driven events (news, earnings, M&A). The current wide net is what produces noisy alpha.
- Skip during low-dispersion markets — Weekly-change extremes in a low-vol regime are usually single-stock events; in high-vol they're market-wide. Different signal characteristics. Gate bearish side to vol > 25% annualized, bullish to vol > 20%, to filter out QE-era compressed-vol noise.
See also Why technical-only signals don't survive on their own for the broader argument.
5 · Before you act — a 5-point checklist
- Normal trading day? Rule out earnings (within ±3 days), ex-dividend, or known corporate-action dates — the signal is almost certainly reading noise, not momentum, in those windows.
- Where is price vs its own 50 / 200 DMA? A trend signal is only as credible as the underlying trend it claims to confirm. Check the 200DMA orientation before acting.
- What's the sector breadth doing? An isolated signal in a broadly down-trending sector is a lower-confidence setup than one firing with the rest of its peer group.
- Is ADV20 enough for your size? If the trigger is on a $500M name and you want to move $1M notional, you're the tape. Consider adv20d ≥ 5% of your intended position.
- What invalidates you? Define a price level (for longs: a close below the trigger-day low; for shorts: close above the trigger-day high) and honor it. The backtest alpha is an average; any one trade can be at either tail.
Execution notes
Neither direction is cleanly tradable. This signal is best interpreted as a SCREENING LENS (quickly find stocks that have moved the most) rather than a predictive trigger. It shows up on most charts because it's a descriptive fact about price action, not a forecast. Keep in the docs for transparency; de-emphasize in the screen composer.