vwap_cross
VWAP Cross
Anchored Volume-Weighted Average Price cross. Bullish: close crosses above VWAP from below. Bearish: close crosses below VWAP from above. Uses rolling N-day anchored VWAP (typical price × volume / volume).
Signal family
Trend — Signals that fire when price is continuing or reversing an established directional move. Momentum-following by nature.
Parameters
| Name | Description | Default | Range |
|---|---|---|---|
| period | VWAP anchor window (days) | 20 | 5–100 |
Historical context
784,978 valid triggers on 3,640 distinct tickers between 2015-02-23 and 2026-04-22. Universe: us_only · mcap ≥ $100,000,000 · price ≥ $1 (3,640 tickers). Entry at open T+1. 1d = intraday T+1; 20d = open T+1 to close T+20.
Benchmarks: spxew (S&P 500 Equal Weight — the primary benchmark here; a median-stock view that avoids the 2020+ megacap-concentration distortion), spx (S&P 500, cap-weighted), and msci (MSCI World USD). Per-stock regime: trending = ADX(14) ≥ 25, high vol = 20d ann. vol ≥ 20%.
At a glance (20d alpha vs S&P 500 Equal Weight, US-only)
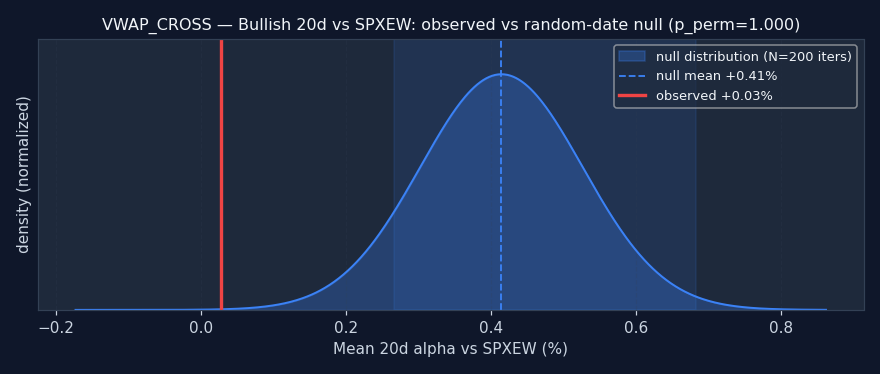
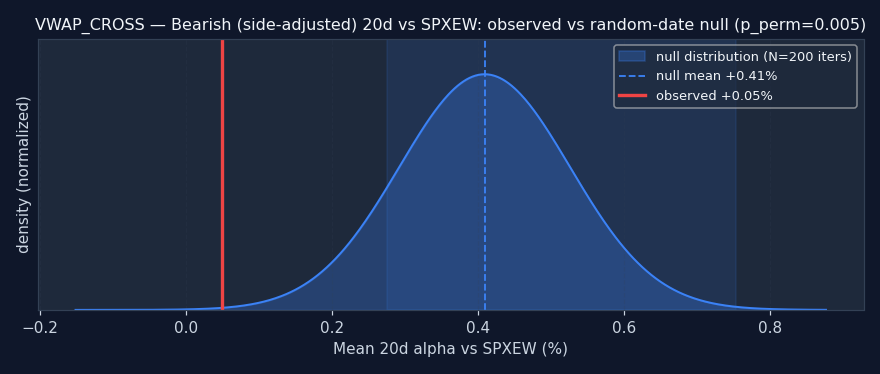
Reading this: the random-date null is: for each ticker, sample N random dates and compute the same alpha — what alpha does a signal with no information produce? If the signal's observed alpha beats the null (pperm≤0.05), it's adding real information. If it's inside or worse than the null, the signal doesn't add value over random firing — any observed alpha is either noise or a universe artifact.
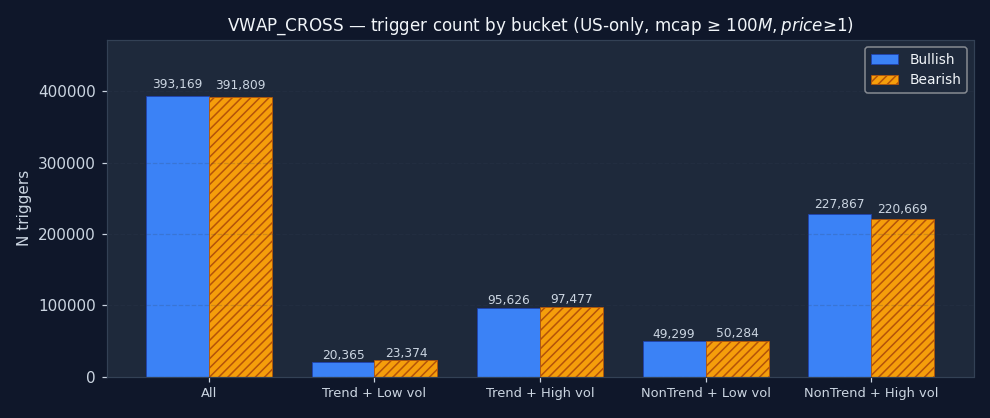
How often does VWAP_CROSS fire in each regime?
The signal's bucket distribution is itself informative. If 50%+ of all VWAP_CROSS triggers fire in the "non-trending + high vol" quadrant, the signal is structurally a chop-market event — regardless of what its textbook definition claims. Bullish and bearish are shown separately; counts are across the full US-only sample after the mcap and price floor.
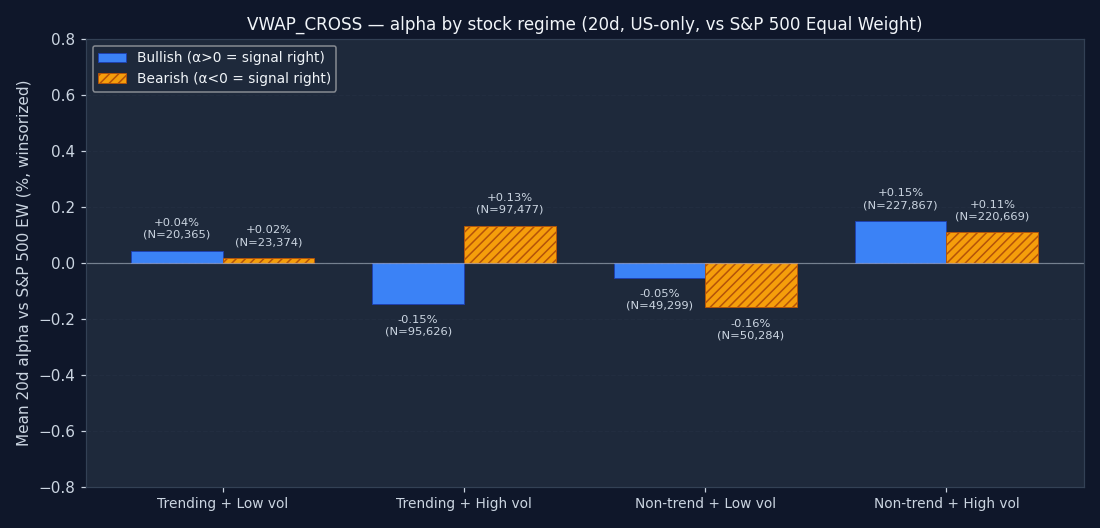
Per-stock regime quadrant — 20d alpha
Each trigger is tagged with the host stock's own technical regime on the trigger date: is the stock itself in a trend (ADX(14) ≥ 25) or ranging? And is its realized 20-day volatility high (≥ 20% annualized) or low? This is the textbook conditioning variable — "does this signal work better in trending stocks?" — answered at the level of the individual stock, not the market. Positive bars are good for the signal; negative bars mean alpha vanishes into the benchmark or worse.
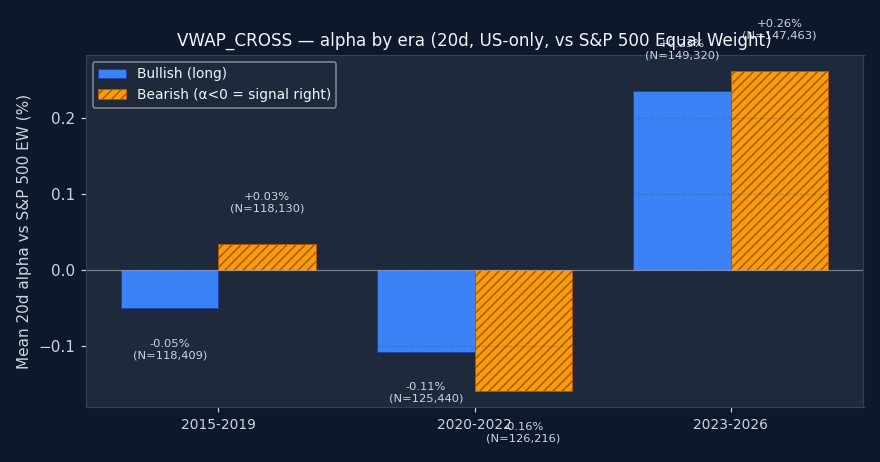
Sub-period check — does the signal work in every era?
A multi-year average can hide major instability. We split the sample into three non-overlapping windows: 2015–2019 (pre-COVID, normalized monetary policy), 2020–2022 (pandemic crash + recovery + rate-shock bear), and 2023+ (post-ZIRP, AI megacap rally). If a signal's alpha is positive overall but comes entirely from one era, that's a red flag — the conditions that produced it may not repeat. A robust signal shows a consistent sign across all non-empty buckets.
↑ Bullish triggers
| Bench | Metric | 1d | 5d | 20d | 60d | 252d |
|---|---|---|---|---|---|---|
| spx | Stock % | -0.02% | +0.14% | +0.92% | +2.60% | +11.63% |
| Bench % | +0.01% | +0.25% | +1.07% | +3.00% | +13.23% | |
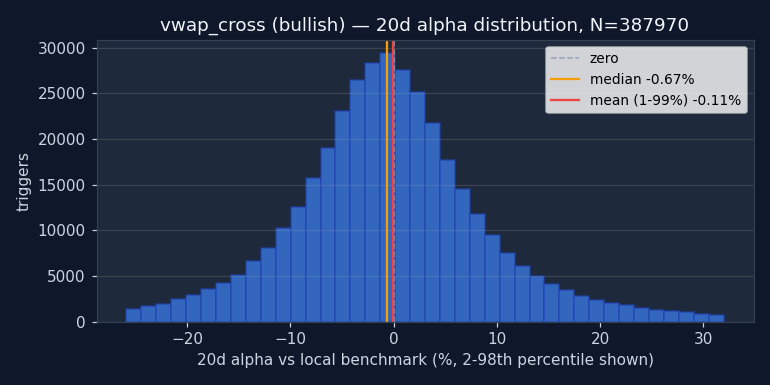
| Alpha % | -0.03% | -0.10% | -0.11% | -0.38% | -1.60% | |
| Median alpha | -0.06% | -0.27% | -0.67% | -1.85% | -8.36% | |
| Hit rate (α>0) | 48.2% | 47.0% | 46.5% | 44.8% | 39.7% | |
| p (naive) | <0.001 | <0.001 | <0.001 | <0.001 | <0.001 | |
| p (HAC) | <0.001 | <0.001 | <0.001 | <0.001 | <0.001 | |
| N | 392,979 | 392,186 | 387,970 | 381,226 | 343,370 | |
| msci | Stock % | -0.02% | +0.14% | +0.92% | +2.60% | +11.63% |
| Bench % | +0.08% | +0.29% | +1.00% | +2.63% | +10.97% | |
| Alpha % | -0.09% | -0.14% | -0.02% | +0.02% | +0.64% | |
| Median alpha | -0.13% | -0.31% | -0.59% | -1.44% | -6.00% | |
| Hit rate (α>0) | 46.6% | 46.5% | 46.9% | 45.9% | 42.6% | |
| p (naive) | <0.001 | <0.001 | 0.2031 | 0.5932 | <0.001 | |
| p (HAC) | <0.001 | <0.001 | 0.3760 | 0.7934 | 0.0368 | |
| N | 391,580 | 389,574 | 385,185 | 379,210 | 341,372 | |
| spxew | Stock % | -0.02% | +0.14% | +0.92% | +2.60% | +11.63% |
| Bench % | +0.03% | +0.22% | +0.96% | +2.39% | +9.93% | |
| Alpha % | -0.06% | -0.07% | +0.03% | +0.25% | +1.88% | |
| Median alpha | -0.08% | -0.21% | -0.48% | -1.18% | -4.97% | |
| Hit rate (α>0) | 47.7% | 47.6% | 47.4% | 46.6% | 43.5% | |
| p (naive) | <0.001 | <0.001 | 0.1503 | <0.001 | <0.001 | |
| p (HAC) | <0.001 | <0.001 | 0.3191 | 0.0003 | <0.001 | |
| N | 391,328 | 389,103 | 384,688 | 378,154 | 340,183 |
Permutation null detail — all horizons × both benchmarks
| Horizon | Bench | Observed α | Null mean | Null 95% CI | pperm |
|---|---|---|---|---|---|
| 1d | spx | -0.03% | -0.01% | [-0.02%, +0.01%] | 0.995 |
| 1d | msci | -0.09% | -0.03% | [-0.05%, -0.02%] | 1.000 |
| 1d | spxew | -0.06% | -0.03% | [-0.05%, -0.02%] | 1.000 |
| 5d | spx | -0.10% | +0.11% | [-0.00%, +0.37%] | 1.000 |
| 5d | msci | -0.14% | +0.12% | [+0.00%, +0.38%] | 1.000 |
| 5d | spxew | -0.07% | +0.14% | [+0.02%, +0.40%] | 1.000 |
| 20d | spx | -0.11% | +0.22% | [+0.07%, +0.49%] | 1.000 |
| 20d | msci | -0.02% | +0.34% | [+0.20%, +0.61%] | 1.000 |
| 20d | spxew | +0.03% | +0.41% | [+0.27%, +0.68%] | 1.000 |
| 60d | spx | -0.38% | +0.45% | [+0.24%, +0.77%] | 1.000 |
| 60d | msci | +0.02% | +0.90% | [+0.68%, +1.22%] | 1.000 |
| 60d | spxew | +0.25% | +1.12% | [+0.92%, +1.44%] | 1.000 |
| 252d | spx | -1.60% | +1.12% | [+0.81%, +1.56%] | 1.000 |
| 252d | msci | +0.64% | +3.44% | [+3.12%, +3.89%] | 1.000 |
| 252d | spxew | +1.88% | +4.79% | [+4.49%, +5.23%] | 1.000 |
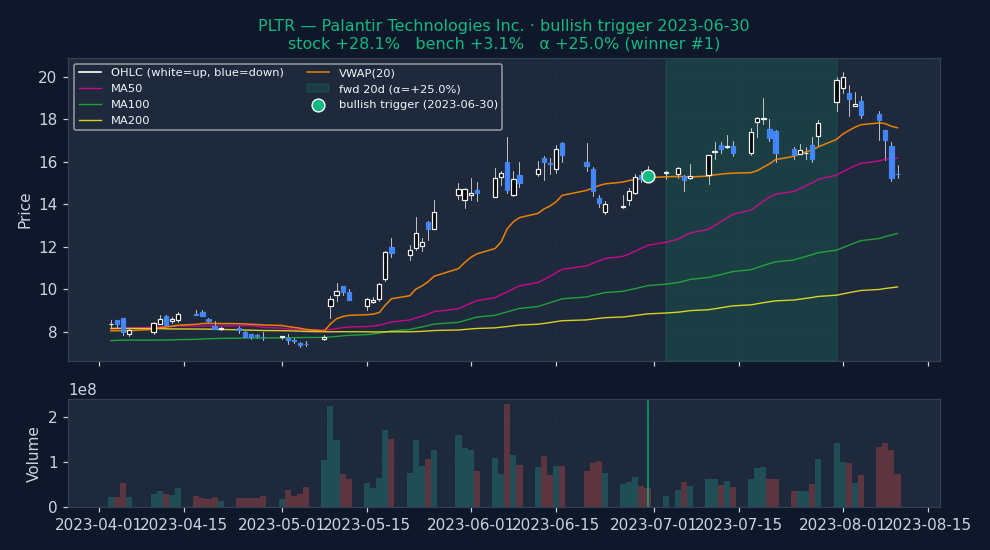
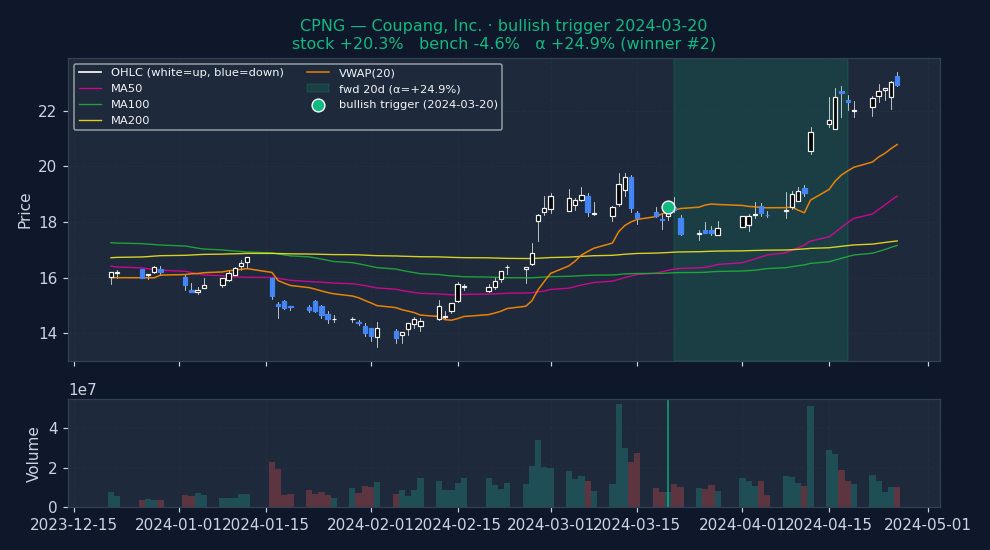
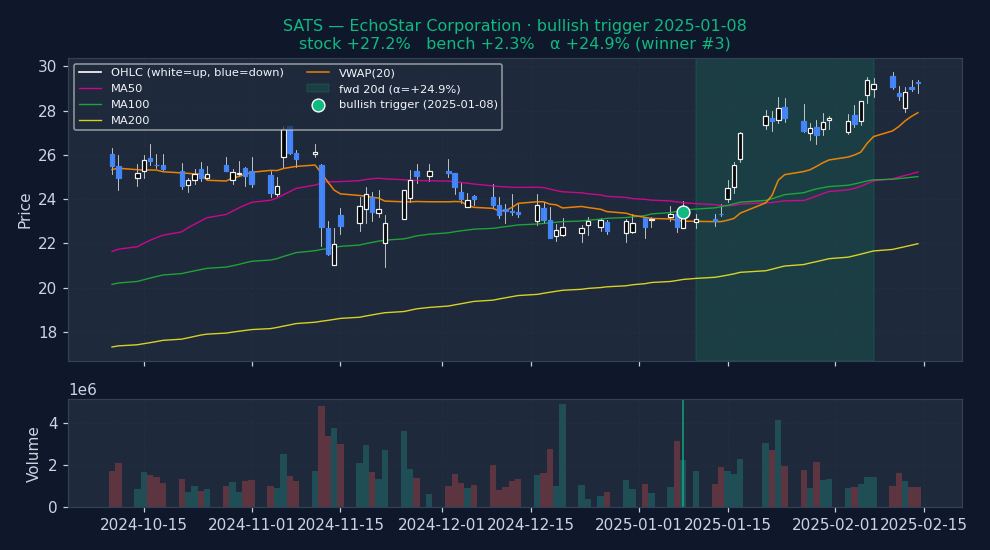
Example triggers on US large-caps (2023+, mcap ≥ $30B)
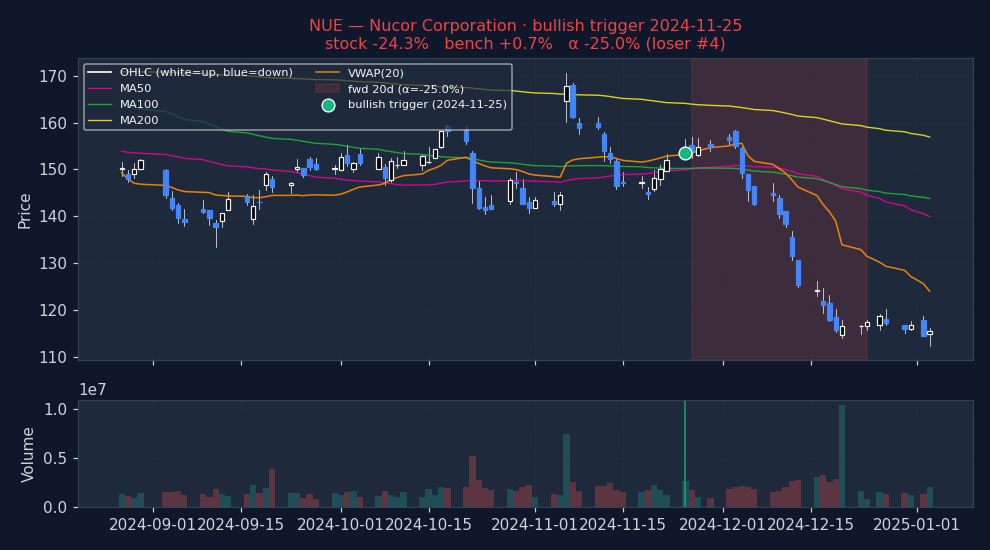
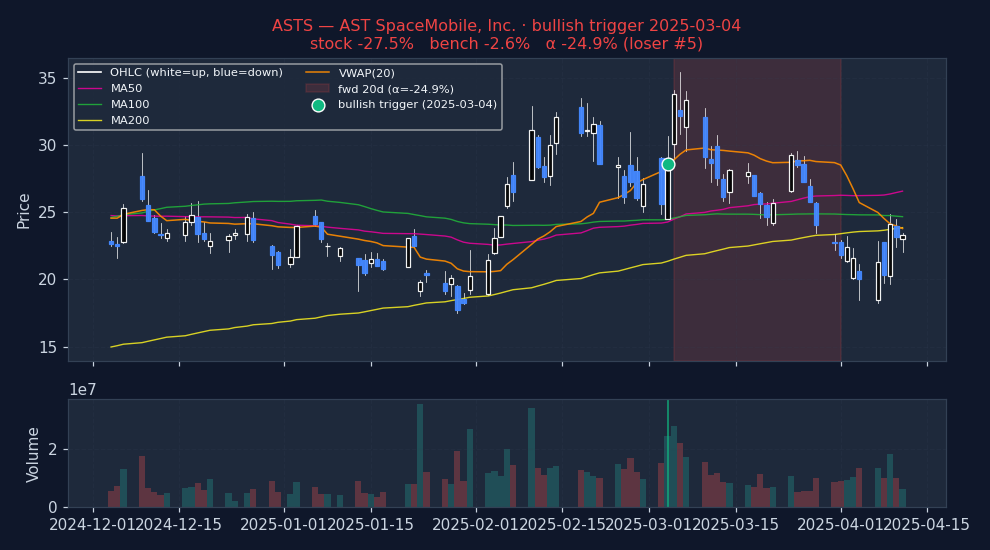
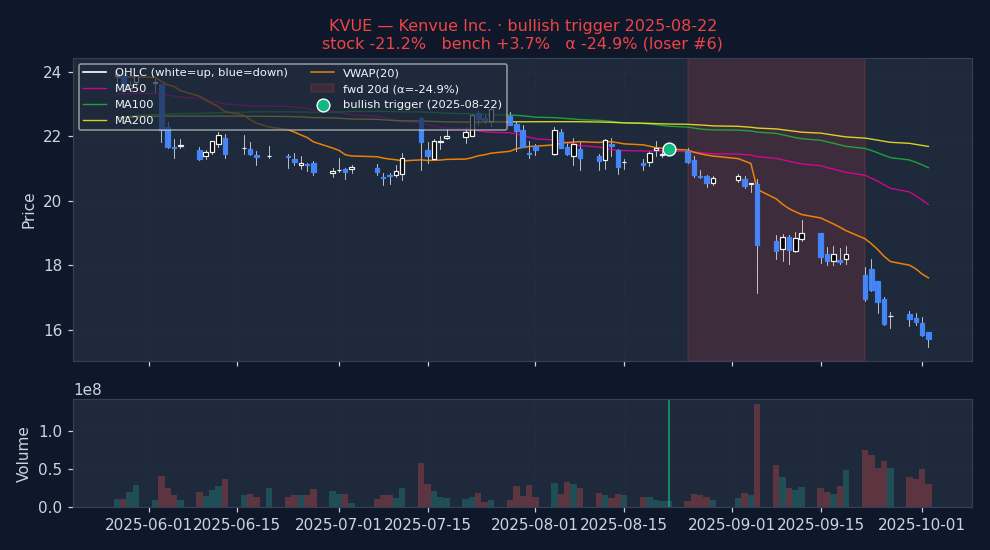
Six recent bullish VWAP_CROSS triggers on US mega-caps, filtered to |alpha| ≤ 25% to exclude catalyst-driven outliers (earnings surprises, M&A, binary events). The first three are the strongest outcomes — what the signal looks like when it works. The last three are the weakest — what the signal looks like when it fails. Each chart shows the stock's price with signal-appropriate technical overlays (e.g. MACD subpanel on MACD pages, Bollinger Bands on Bollinger pages, the 52-week trailing max line on 52w-high pages), a dot marking the trigger date, and the forward window shaded (green when the signal was right, red when it wasn't). Click any chart to open full-size.
Strongest outcomes (what VWAP_CROSS looks like when it works)
Weakest outcomes (what VWAP_CROSS looks like when it fails)
Stock-regime quadrants (2×2 per-stock, 20d alpha detail table)
| Quadrant | N | Stock % (spx) | Bench % (spx) | Alpha % (spx) | p (HAC) | Stock % (msci) | Bench % (msci) | Alpha % (msci) | p (HAC) | Stock % (spxew) | Bench % (spxew) | Alpha % (spxew) | p (HAC) |
|---|---|---|---|---|---|---|---|---|---|---|---|---|---|
| Trending + Low vol Clean directional grind, low whipsaw | 20,365 | +0.44% | +0.71% | -0.25% | <0.001 | +0.44% | +0.56% | -0.09% | 0.0719 | +0.44% | +0.46% | +0.04% | 0.4101 |
| Trending + High vol Crisis selloff or parabolic rally | 95,626 | +0.88% | +1.21% | -0.29% | <0.001 | +0.88% | +1.13% | -0.19% | 0.0012 | +0.88% | +1.10% | -0.15% | 0.0101 |
| Non-trending + Low vol Quiet chop, summer doldrums | 49,299 | +0.37% | +0.75% | -0.35% | <0.001 | +0.37% | +0.58% | -0.18% | <0.001 | +0.37% | +0.47% | -0.05% | 0.1312 |
| Non-trending + High vol Classical "whipsaw zone" for momentum | 227,867 | +1.15% | +1.11% | +0.07% | 0.0562 | +1.15% | +1.08% | +0.12% | 0.0013 | +1.15% | +1.05% | +0.15% | <0.001 |
Sub-period breakdown table (20d alpha)
| Period | N | Alpha % (spx) | p (HAC) | Alpha % (msci) | p (HAC) | Alpha % (spxew) | p (HAC) |
|---|---|---|---|---|---|---|---|
| 2015-2019 2015-01-01 → 2020-01-01 | 118,409 | -0.23% | <0.001 | -0.10% | 0.0113 | -0.05% | 0.2047 |
| 2020-2022 2020-01-01 → 2023-01-01 | 125,440 | +0.22% | <0.001 | +0.32% | <0.001 | -0.11% | 0.0366 |
| 2023-2026 2023-01-01 → 2099-01-01 | 149,320 | -0.27% | <0.001 | -0.23% | <0.001 | +0.23% | <0.001 |
↓ Bearish triggers negative alpha = signal was right (stock underperformed market)
| Bench | Metric | 1d | 5d | 20d | 60d | 252d |
|---|---|---|---|---|---|---|
| spx | Stock % | -0.01% | +0.24% | +0.84% | +2.70% | +11.51% |
| Bench % | +0.01% | +0.25% | +1.03% | +3.04% | +13.21% | |
| Alpha % | -0.02% | -0.01% | -0.14% | -0.33% | -1.71% | |
| Median alpha | -0.02% | -0.14% | -0.64% | -1.75% | -8.34% | |
| Hit rate (α>0) | 49.4% | 48.4% | 46.6% | 45.1% | 39.7% | |
| p (naive) | <0.001 | 0.4972 | <0.001 | <0.001 | <0.001 | |
| p (HAC) | <0.001 | 0.5246 | <0.001 | <0.001 | <0.001 | |
| N | 391,660 | 391,048 | 388,579 | 381,038 | 344,120 | |
| msci | Stock % | -0.01% | +0.24% | +0.84% | +2.70% | +11.51% |
| Bench % | -0.00% | +0.21% | +0.91% | +2.60% | +10.85% | |
| Alpha % | -0.00% | +0.05% | +0.02% | +0.15% | +0.68% | |
| Median alpha | -0.01% | -0.09% | -0.48% | -1.26% | -5.89% | |
| Hit rate (α>0) | 49.6% | 49.0% | 47.4% | 46.4% | 42.7% | |
| p (naive) | 0.2718 | <0.001 | 0.2000 | <0.001 | <0.001 | |
| p (HAC) | 0.2737 | <0.001 | 0.3755 | 0.0320 | 0.0259 | |
| N | 390,551 | 389,273 | 386,398 | 378,653 | 341,455 | |
| spxew | Stock % | -0.01% | +0.24% | +0.84% | +2.70% | +11.51% |
| Bench % | +0.03% | +0.23% | +0.90% | +2.40% | +9.80% | |
| Alpha % | -0.04% | +0.01% | +0.05% | +0.33% | +1.86% | |
| Median alpha | -0.03% | -0.10% | -0.42% | -1.04% | -4.90% | |
| Hit rate (α>0) | 49.1% | 48.9% | 47.7% | 47.0% | 43.5% | |
| p (naive) | <0.001 | 0.1071 | 0.0080 | <0.001 | <0.001 | |
| p (HAC) | <0.001 | 0.1318 | 0.0678 | <0.001 | <0.001 | |
| N | 390,140 | 387,879 | 385,247 | 378,387 | 340,631 |
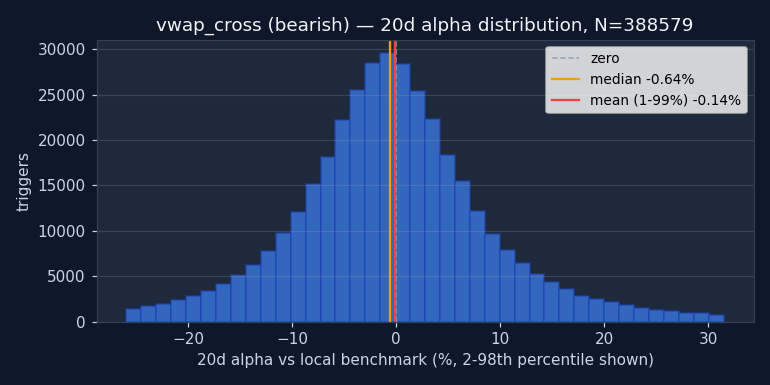
Permutation null detail — all horizons × both benchmarks
| Horizon | Bench | Observed α | Null mean | Null 95% CI | pperm |
|---|---|---|---|---|---|
| 1d | spx | -0.02% | -0.00% | [-0.02%, +0.20%] | 0.040 |
| 1d | msci | -0.00% | -0.03% | [-0.05%, +0.18%] | 0.960 |
| 1d | spxew | -0.04% | -0.03% | [-0.05%, +0.18%] | 0.149 |
| 5d | spx | -0.01% | +0.10% | [+0.00%, +0.41%] | 0.005 |
| 5d | msci | +0.05% | +0.11% | [+0.01%, +0.41%] | 0.428 |
| 5d | spxew | +0.01% | +0.13% | [+0.03%, +0.44%] | 0.005 |
| 20d | spx | -0.14% | +0.22% | [+0.08%, +0.56%] | 0.005 |
| 20d | msci | +0.02% | +0.34% | [+0.20%, +0.68%] | 0.005 |
| 20d | spxew | +0.05% | +0.41% | [+0.27%, +0.75%] | 0.005 |
| 60d | spx | -0.33% | +0.46% | [+0.25%, +0.74%] | 0.005 |
| 60d | msci | +0.15% | +0.90% | [+0.69%, +1.18%] | 0.005 |
| 60d | spxew | +0.33% | +1.13% | [+0.91%, +1.41%] | 0.005 |
| 252d | spx | -1.71% | +1.12% | [+0.73%, +1.65%] | 0.005 |
| 252d | msci | +0.68% | +3.44% | [+3.05%, +3.98%] | 0.005 |
| 252d | spxew | +1.86% | +4.80% | [+4.39%, +5.33%] | 0.005 |
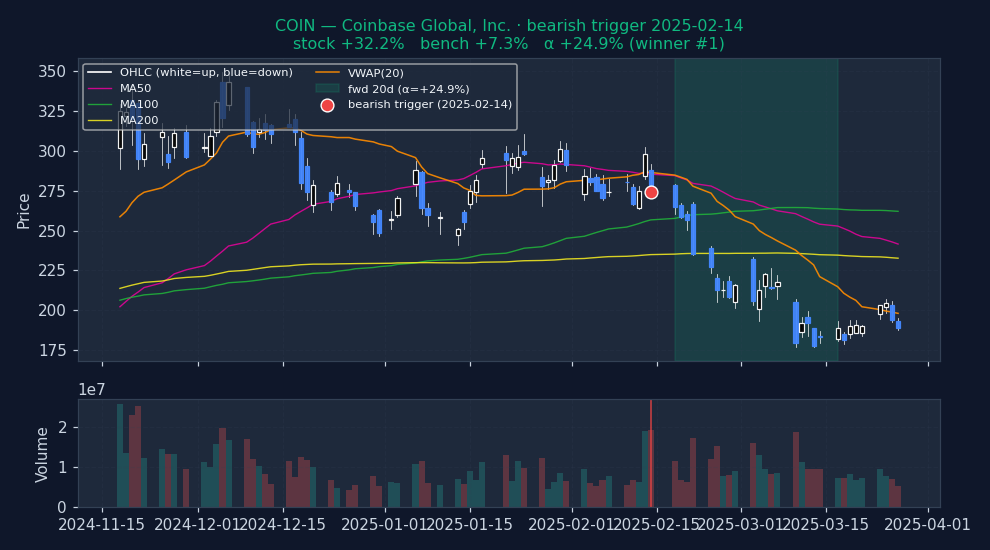
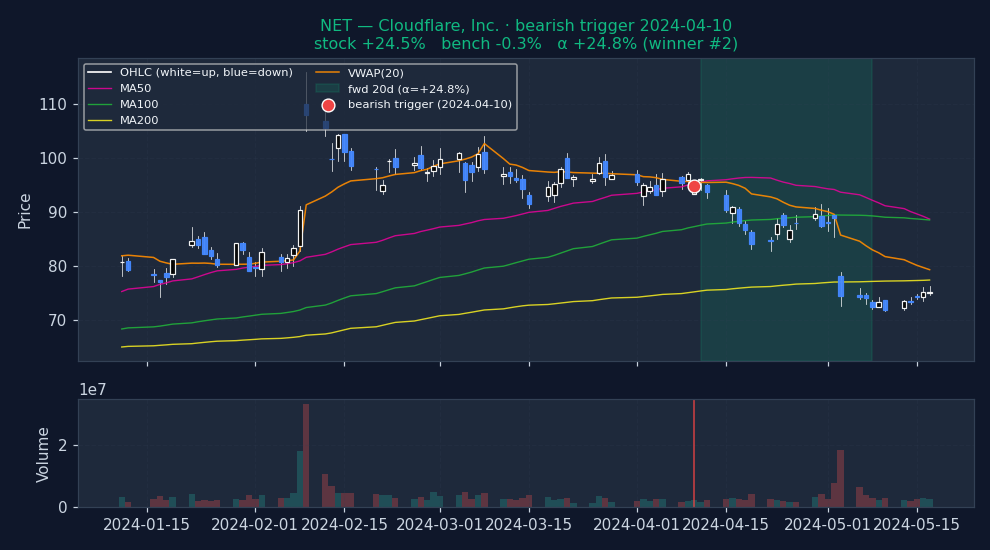
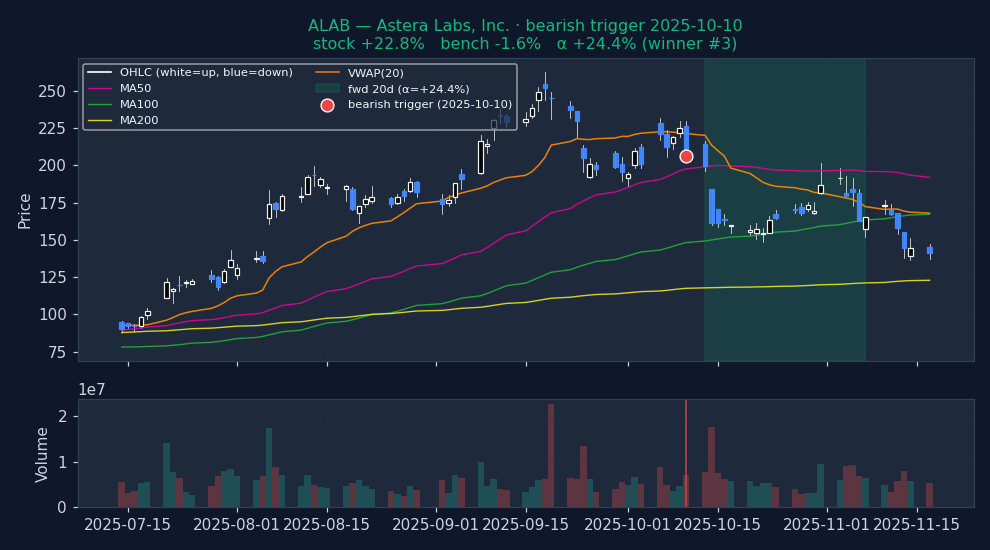
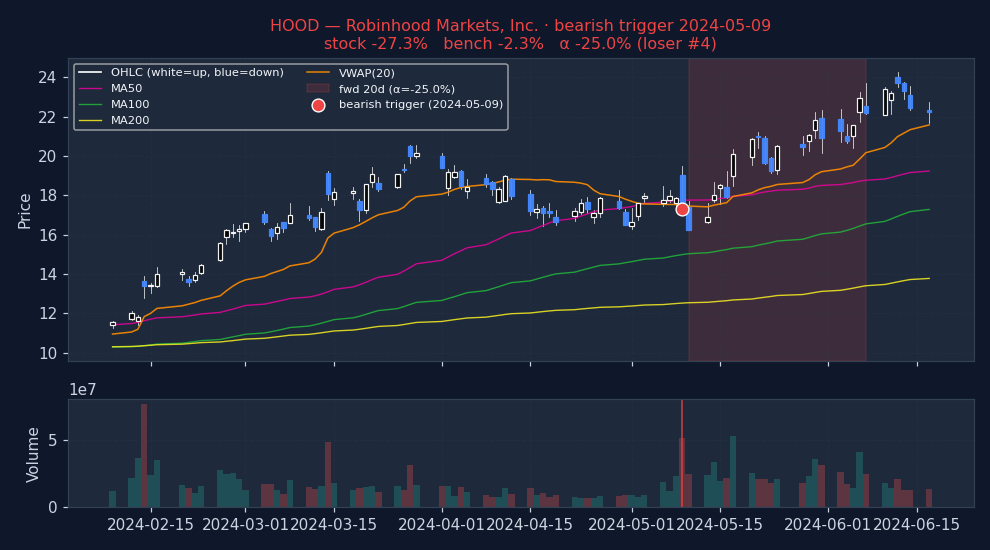
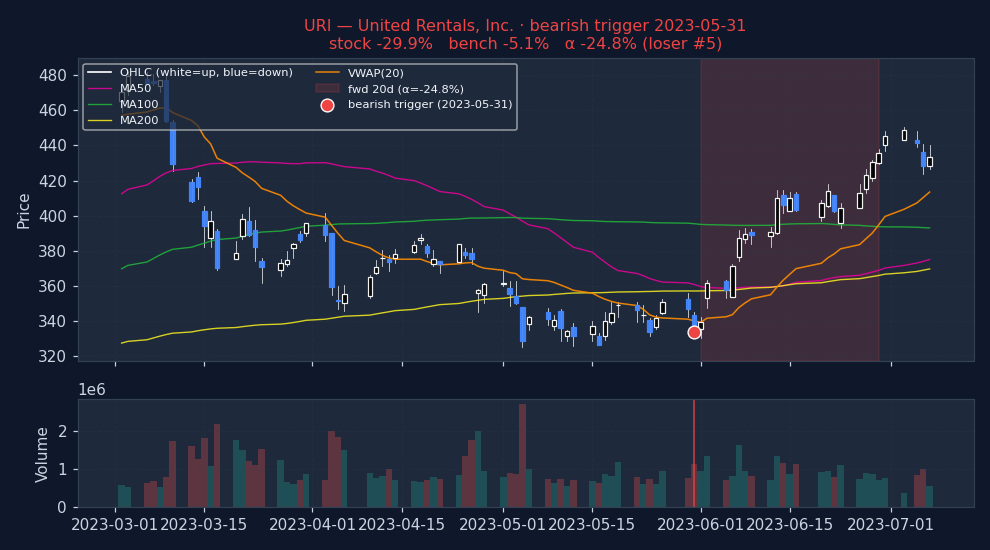
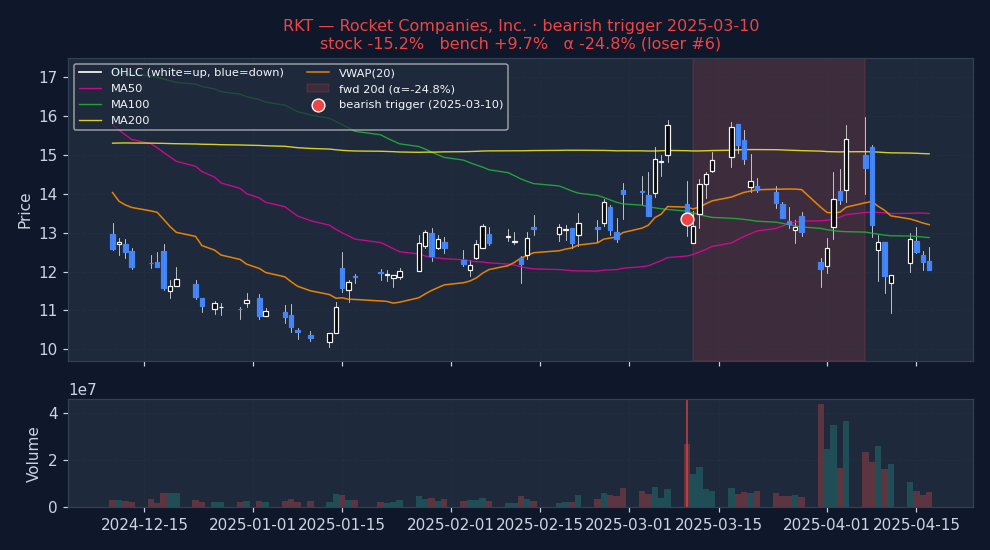
Example triggers on US large-caps (2023+, mcap ≥ $30B)
Six recent bearish VWAP_CROSS triggers on US mega-caps, filtered to |alpha| ≤ 25% to exclude catalyst-driven outliers (earnings surprises, M&A, binary events). The first three are the strongest outcomes — what the signal looks like when it works. The last three are the weakest — what the signal looks like when it fails. Each chart shows the stock's price with signal-appropriate technical overlays (e.g. MACD subpanel on MACD pages, Bollinger Bands on Bollinger pages, the 52-week trailing max line on 52w-high pages), a dot marking the trigger date, and the forward window shaded (green when the signal was right, red when it wasn't). Click any chart to open full-size.
Strongest outcomes (what VWAP_CROSS looks like when it works)
Weakest outcomes (what VWAP_CROSS looks like when it fails)
Stock-regime quadrants (2×2 per-stock, 20d alpha detail table)
| Quadrant | N | Stock % (spx) | Bench % (spx) | Alpha % (spx) | p (HAC) | Stock % (msci) | Bench % (msci) | Alpha % (msci) | p (HAC) | Stock % (spxew) | Bench % (spxew) | Alpha % (spxew) | p (HAC) |
|---|---|---|---|---|---|---|---|---|---|---|---|---|---|
| Trending + Low vol Clean directional grind, low whipsaw | 23,374 | +0.25% | +0.59% | -0.33% | <0.001 | +0.25% | +0.39% | -0.11% | 0.0169 | +0.25% | +0.25% | +0.02% | 0.7385 |
| Trending + High vol Crisis selloff or parabolic rally | 97,477 | +0.95% | +1.11% | -0.13% | 0.0320 | +0.95% | +0.95% | +0.07% | 0.2143 | +0.95% | +0.92% | +0.13% | 0.0258 |
| Non-trending + Low vol Quiet chop, summer doldrums | 50,284 | +0.25% | +0.75% | -0.47% | <0.001 | +0.25% | +0.52% | -0.23% | <0.001 | +0.25% | +0.46% | -0.16% | <0.001 |
| Non-trending + High vol Classical "whipsaw zone" for momentum | 220,669 | +1.05% | +1.10% | +0.00% | 0.9150 | +1.05% | +1.01% | +0.12% | 0.0009 | +1.05% | +1.04% | +0.11% | 0.0030 |
Sub-period breakdown table (20d alpha)
| Period | N | Alpha % (spx) | p (HAC) | Alpha % (msci) | p (HAC) | Alpha % (spxew) | p (HAC) |
|---|---|---|---|---|---|---|---|
| 2015-2019 2015-01-01 → 2020-01-01 | 118,130 | -0.19% | <0.001 | +0.00% | 0.9516 | +0.03% | 0.3880 |
| 2020-2022 2020-01-01 → 2023-01-01 | 126,216 | +0.18% | 0.0003 | +0.33% | <0.001 | -0.16% | 0.0015 |
| 2023-2026 2023-01-01 → 2099-01-01 | 147,463 | -0.34% | <0.001 | -0.20% | <0.001 | +0.26% | <0.001 |
Methodology and caveats
How to read. Entry at open of T+1 (one trading day after the signal fires on close of T). 20d = open T+1 to close T+20. Alpha = stock return − benchmark return over the same window (Convention A, single-sided, textbook). For bullish triggers, POSITIVE alpha = signal was right. For bearish triggers, NEGATIVE alpha = signal was right (stock underperformed market). No sign-flipping; the direction of the bet determines what "good" looks like. Per-stock regime is each stock's own ADX(14) and RV(20) at the trigger date — not market-wide state.
Three p-values, three robustness tests. (a) p_naive: scipy one-sample t-test on winsorized alphas. Optimistic because overlapping 20d windows on the same ticker inflate effective N. (b) p_hac: Newey-West HAC with lag = horizon — corrects for the overlap and is the academic-finance standard. (c) p_perm: fraction of 200 random-date null iterations with mean ≥ observed. Tests whether the signal beats random date selection at all. A signal that clears all three (pnaive, phac, pperm all < 0.05) has real information; a signal that fails pperm has zero edge even if the t-test says "significant."
Caveats. (i) Universe reflects today's active tickers; delisted losers pruned → survivorship bias. (ii) Mcap ≥ $100M filter uses today's snapshot, not point-in-time — mild lookahead on which stocks enter the sample, not on returns. (iii) Means and p-values use winsorized alphas (1/99 percentile) to prevent data errors from dominating. Medians and hit rates use raw data. (iv) Zero transaction costs assumed. Realistic bid-ask + commissions remove 20–40bps from 20d alpha on US large-caps, more on small-cap. Sub-20bps alpha is noise in practice. (v) Past performance does not predict future results.
How to use this
1 · When to reach for this signal
Caution recommended. Bullish 20d alpha is -0.11% and worse than random — triggering on random dates would have produced better long-side returns. Either direction fails the "beats random" test. Don't use VWAP Cross as a standalone entry trigger. It may still be useful as part of a composite (section 4).
2 · When it works — the setups that drive it
- Best bullish setup: Non-trending + High vol — alpha +0.07% / 20d on 227,867 historical triggers.
- Best bearish setup: Non-trending + High vol — alpha +0.00% / 20d on 220,669 historical triggers.
- Best era for bullish: 2020-2022 — alpha +0.22% / 20d.
- Best era for bearish: 2020-2022 — alpha +0.18% / 20d.
3 · When it fails — common false positives
- Weakest bullish cell: Non-trending + Low vol — alpha -0.35% / 20d on 49,299 triggers.
- Weakest bearish cell: Non-trending + Low vol — alpha -0.47% / 20d on 50,284 triggers.
- Worst era for bullish: 2023-2026 — alpha -0.27% / 20d.
- Worst era for bearish: 2023-2026 — alpha -0.34% / 20d.
Signal-specific failure patterns
4 · Pairing inside a screen
The statements below describe how this signal relates to others by construction — which indicator family it belongs to, and where same-family redundancy might reduce the independence of evidence inside a Daily Report. These are taxonomic classifications drawn from standard technical-analysis texts; they are not pairing backtests. A multi-signal convergence backtest is planned but not yet run.
No classical-TA family-redundancy claim applies to this signal. Pairing behaviour is a backtest question and has not been measured yet.
What would likely rescue this signal
This block calls out the data or conditions that could turn a technically weak signal into a usable one in a composite screen. Based on signal mechanics and the observed failure patterns above; individual combinations are not yet backtested.
- Multi-day VWAP structure — Current implementation triggers on single-day cross. A 5-day sustained close above/below VWAP is structurally more meaningful. Parameter change, testable.
- Pair with trend filter — Bearish VWAP cross below 50DMA = aligned breakdown. Above 50DMA = possible pullback in uptrend. Separating the two regimes would clarify which cells carry real alpha.
See also Why technical-only signals don't survive on their own for the broader argument.
5 · Before you act — a 5-point checklist
- Normal trading day? Rule out earnings (within ±3 days), ex-dividend, or known corporate-action dates — the signal is almost certainly reading noise, not momentum, in those windows.
- Where is price vs its own 50 / 200 DMA? A trend signal is only as credible as the underlying trend it claims to confirm. Check the 200DMA orientation before acting.
- What's the sector breadth doing? An isolated signal in a broadly down-trending sector is a lower-confidence setup than one firing with the rest of its peer group.
- Is ADV20 enough for your size? If the trigger is on a $500M name and you want to move $1M notional, you're the tape. Consider adv20d ≥ 5% of your intended position.
- What invalidates you? Define a price level (for longs: a close below the trigger-day low; for shorts: close above the trigger-day high) and honor it. The backtest alpha is an average; any one trade can be at either tail.
Execution notes
Bearish side tradable, bullish not. 60d alpha is 2.4x the 20d alpha for bearish — hold through. Entry open T+1. Understand that VWAP is intrinsically single-day; multi-day sustained closes above/below VWAP would be a different (possibly better) signal to build.