new_20d_high
20-Day New High
Triggers when price makes a new N-day high with a green candle (close >= open). Bullish only — use '20-Day New Low' for bearish.
Signal family
Trend — Signals that fire when price is continuing or reversing an established directional move. Momentum-following by nature.
Parameters
| Name | Description | Default | Range |
|---|---|---|---|
| period | Lookback period (days) | 20 | 5–252 |
Historical context
664,944 valid triggers on 3,599 distinct tickers between 2015-02-26 and 2026-04-22. Universe: us_only · mcap ≥ $100,000,000 · price ≥ $1 (3,599 tickers). Entry at open T+1. 1d = intraday T+1; 20d = open T+1 to close T+20.
Benchmarks: spxew (S&P 500 Equal Weight — the primary benchmark here; a median-stock view that avoids the 2020+ megacap-concentration distortion), spx (S&P 500, cap-weighted), and msci (MSCI World USD). Per-stock regime: trending = ADX(14) ≥ 25, high vol = 20d ann. vol ≥ 20%.
At a glance (20d alpha vs S&P 500 Equal Weight, US-only)
20-Day New High is a single-direction signal — only the bullish side is meaningful. (The trigger condition only describes one side of the move.)
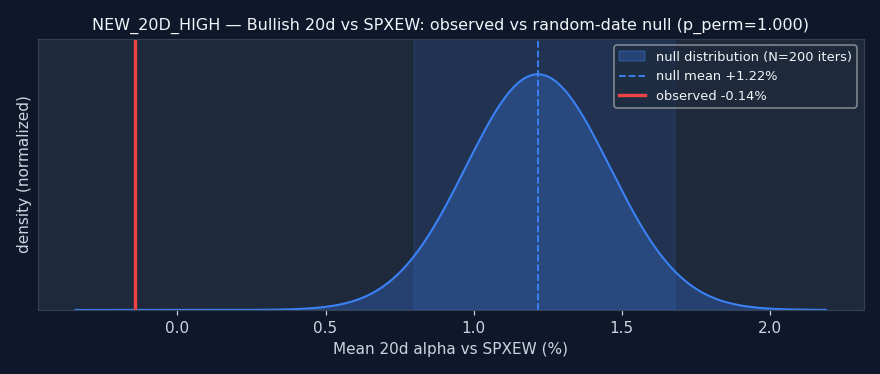
Reading this: the random-date null is: for each ticker, sample N random dates and compute the same alpha — what alpha does a signal with no information produce? If the signal's observed alpha beats the null (pperm≤0.05), it's adding real information. If it's inside or worse than the null, the signal doesn't add value over random firing — any observed alpha is either noise or a universe artifact.
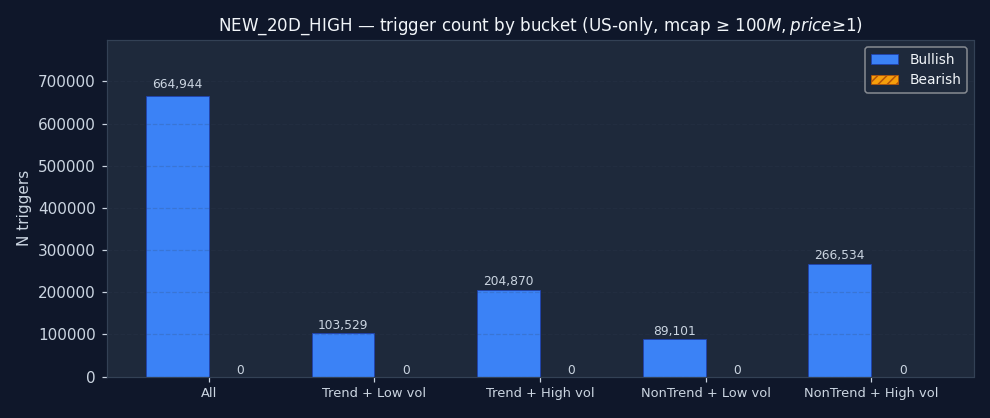
How often does NEW_20D_HIGH fire in each regime?
The signal's bucket distribution is itself informative. If 50%+ of all NEW_20D_HIGH triggers fire in the "non-trending + high vol" quadrant, the signal is structurally a chop-market event — regardless of what its textbook definition claims. Bullish and bearish are shown separately; counts are across the full US-only sample after the mcap and price floor.
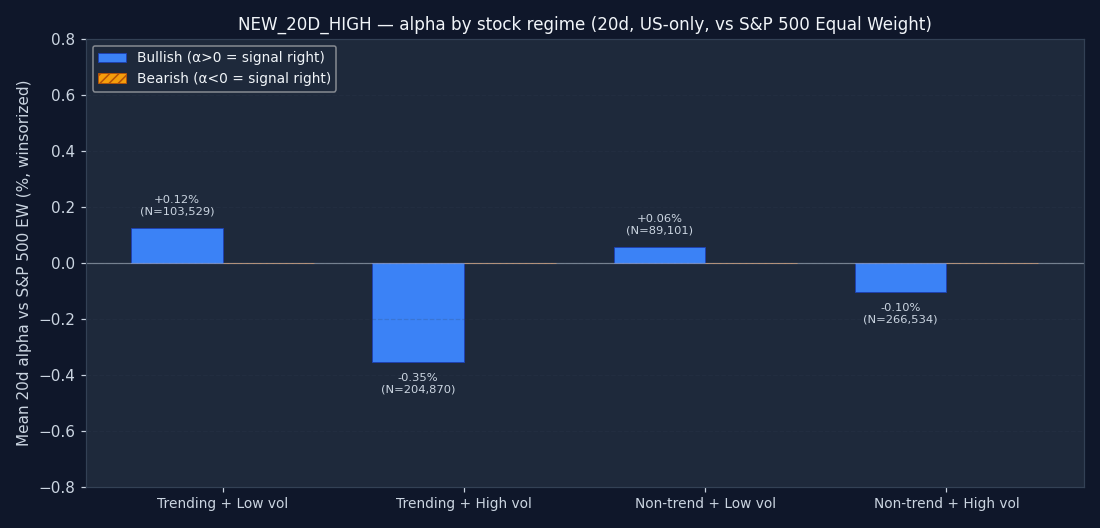
Per-stock regime quadrant — 20d alpha
Each trigger is tagged with the host stock's own technical regime on the trigger date: is the stock itself in a trend (ADX(14) ≥ 25) or ranging? And is its realized 20-day volatility high (≥ 20% annualized) or low? This is the textbook conditioning variable — "does this signal work better in trending stocks?" — answered at the level of the individual stock, not the market. Positive bars are good for the signal; negative bars mean alpha vanishes into the benchmark or worse.
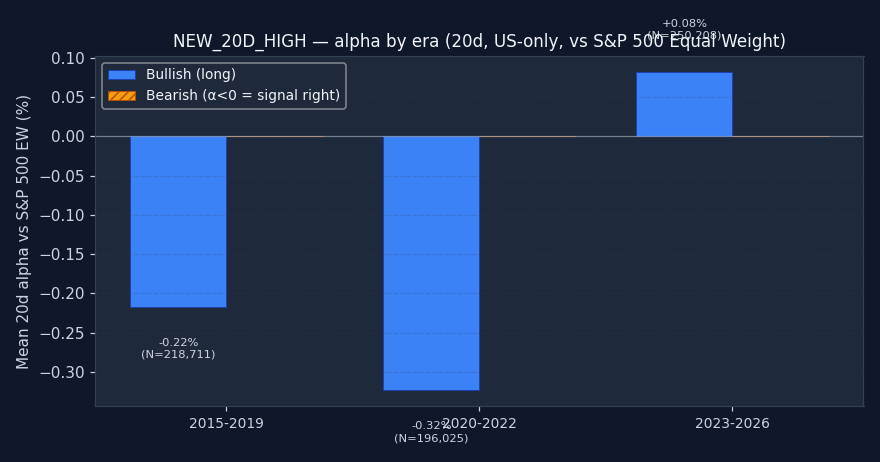
Sub-period check — does the signal work in every era?
A multi-year average can hide major instability. We split the sample into three non-overlapping windows: 2015–2019 (pre-COVID, normalized monetary policy), 2020–2022 (pandemic crash + recovery + rate-shock bear), and 2023+ (post-ZIRP, AI megacap rally). If a signal's alpha is positive overall but comes entirely from one era, that's a red flag — the conditions that produced it may not repeat. A robust signal shows a consistent sign across all non-empty buckets.
↑ Bullish triggers
| Bench | Metric | 1d | 5d | 20d | 60d | 252d |
|---|---|---|---|---|---|---|
| spx | Stock % | -0.03% | +0.03% | +0.48% | +1.91% | +10.57% |
| Bench % | +0.01% | +0.18% | +0.90% | +2.72% | +13.05% | |
| Alpha % | -0.04% | -0.13% | -0.37% | -0.79% | -2.48% | |
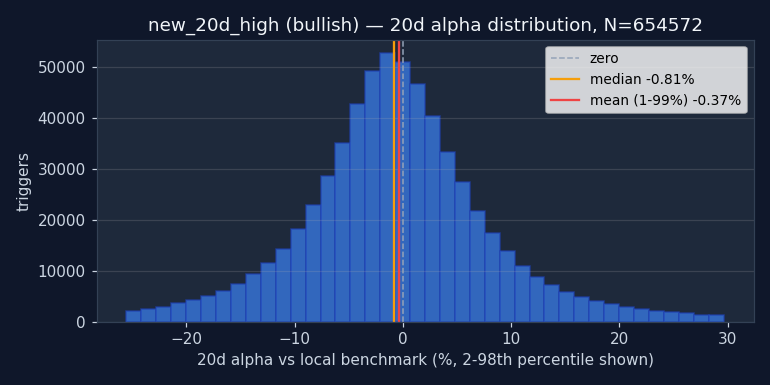
| Median alpha | -0.04% | -0.23% | -0.81% | -1.95% | -8.12% | |
| Hit rate (α>0) | 48.6% | 47.1% | 45.3% | 44.0% | 39.4% | |
| p (naive) | <0.001 | <0.001 | <0.001 | <0.001 | <0.001 | |
| p (HAC) | <0.001 | <0.001 | <0.001 | <0.001 | <0.001 | |
| N | 664,631 | 660,497 | 654,572 | 644,161 | 575,786 | |
| msci | Stock % | -0.03% | +0.03% | +0.48% | +1.91% | +10.57% |
| Bench % | +0.05% | +0.18% | +0.78% | +2.25% | +10.44% | |
| Alpha % | -0.08% | -0.14% | -0.24% | -0.29% | +0.11% | |
| Median alpha | -0.08% | -0.23% | -0.69% | -1.43% | -5.50% | |
| Hit rate (α>0) | 47.5% | 47.1% | 46.0% | 45.5% | 42.8% | |
| p (naive) | <0.001 | <0.001 | <0.001 | <0.001 | 0.0636 | |
| p (HAC) | <0.001 | <0.001 | <0.001 | <0.001 | 0.7342 | |
| N | 660,713 | 656,669 | 651,417 | 640,487 | 572,624 | |
| spxew | Stock % | -0.03% | +0.03% | +0.48% | +1.91% | +10.57% |
| Bench % | +0.03% | +0.14% | +0.68% | +1.91% | +9.22% | |
| Alpha % | -0.06% | -0.11% | -0.14% | +0.04% | +1.50% | |
| Median alpha | -0.04% | -0.17% | -0.55% | -1.11% | -4.21% | |
| Hit rate (α>0) | 48.6% | 47.7% | 46.7% | 46.4% | 44.1% | |
| p (naive) | <0.001 | <0.001 | <0.001 | 0.1453 | <0.001 | |
| p (HAC) | <0.001 | <0.001 | <0.001 | 0.6363 | <0.001 | |
| N | 661,136 | 654,029 | 648,239 | 638,413 | 569,996 |
Permutation null detail — all horizons × both benchmarks
| Horizon | Bench | Observed α | Null mean | Null 95% CI | pperm |
|---|---|---|---|---|---|
| 1d | spx | -0.04% | +0.01% | [-0.01%, +0.12%] | 1.000 |
| 1d | msci | -0.08% | -0.02% | [-0.03%, +0.10%] | 1.000 |
| 1d | spxew | -0.06% | -0.02% | [-0.03%, +0.10%] | 1.000 |
| 5d | spx | -0.13% | +0.83% | [+0.43%, +1.30%] | 1.000 |
| 5d | msci | -0.14% | +0.84% | [+0.44%, +1.31%] | 1.000 |
| 5d | spxew | -0.11% | +0.86% | [+0.46%, +1.34%] | 1.000 |
| 20d | spx | -0.37% | +1.02% | [+0.60%, +1.48%] | 1.000 |
| 20d | msci | -0.24% | +1.14% | [+0.72%, +1.61%] | 1.000 |
| 20d | spxew | -0.14% | +1.22% | [+0.80%, +1.68%] | 1.000 |
| 60d | spx | -0.79% | +1.61% | [+1.20%, +2.11%] | 1.000 |
| 60d | msci | -0.29% | +2.06% | [+1.64%, +2.55%] | 1.000 |
| 60d | spxew | +0.04% | +2.28% | [+1.86%, +2.78%] | 1.000 |
| 252d | spx | -2.48% | +2.37% | [+2.09%, +2.71%] | 1.000 |
| 252d | msci | +0.11% | +4.68% | [+4.39%, +5.03%] | 1.000 |
| 252d | spxew | +1.50% | +6.01% | [+5.72%, +6.35%] | 1.000 |
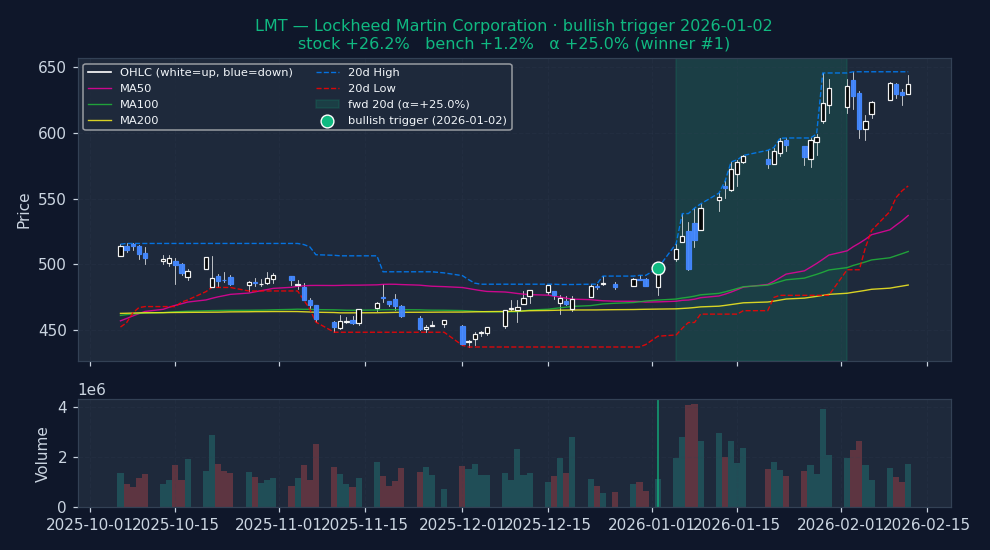
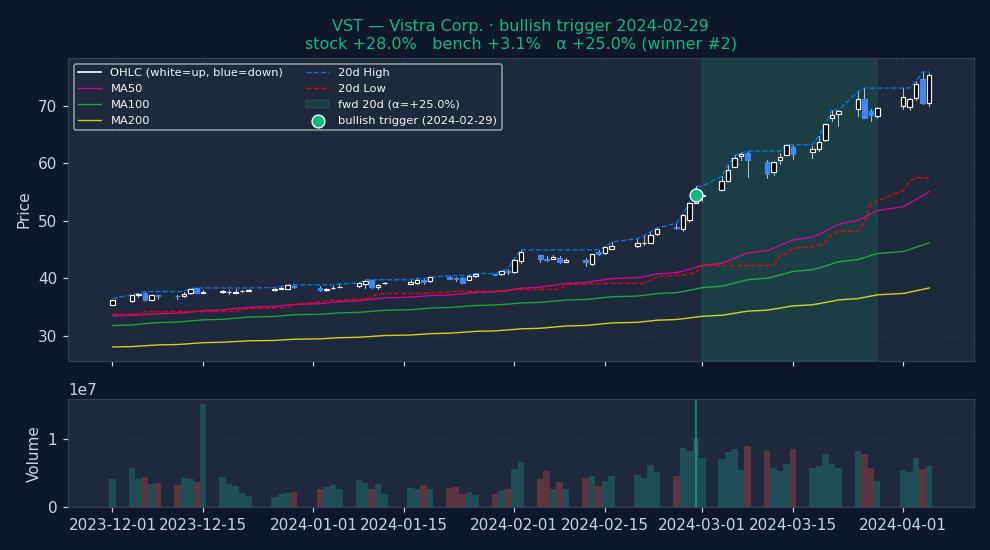
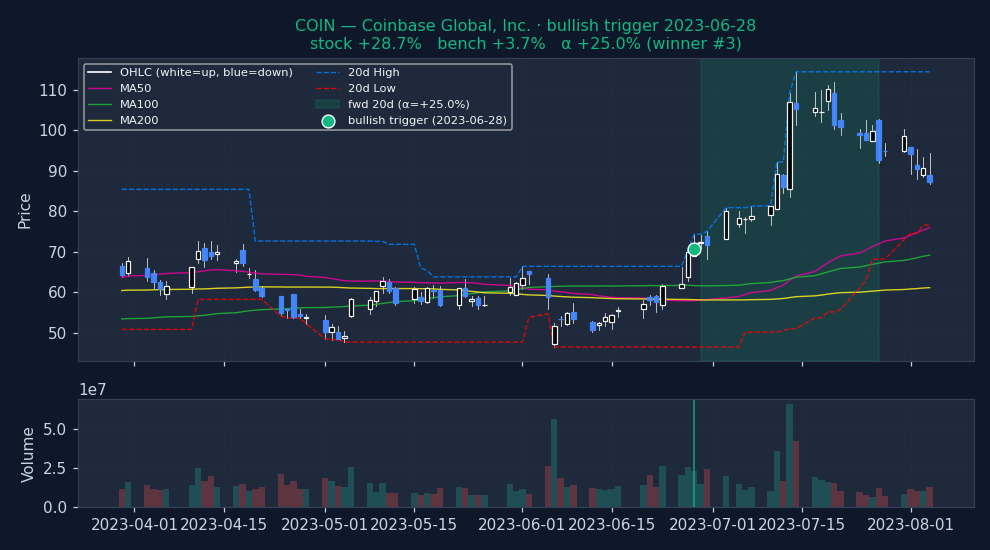
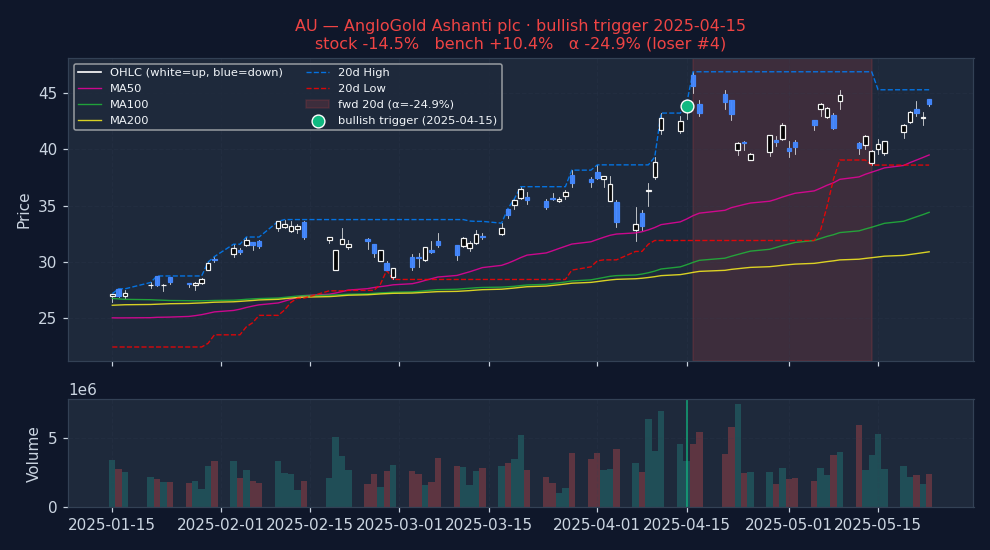
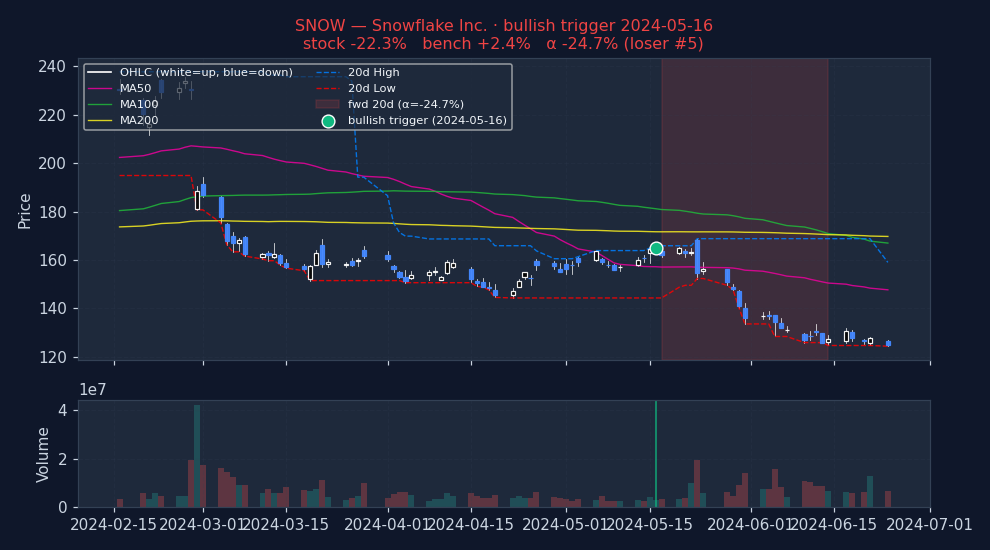
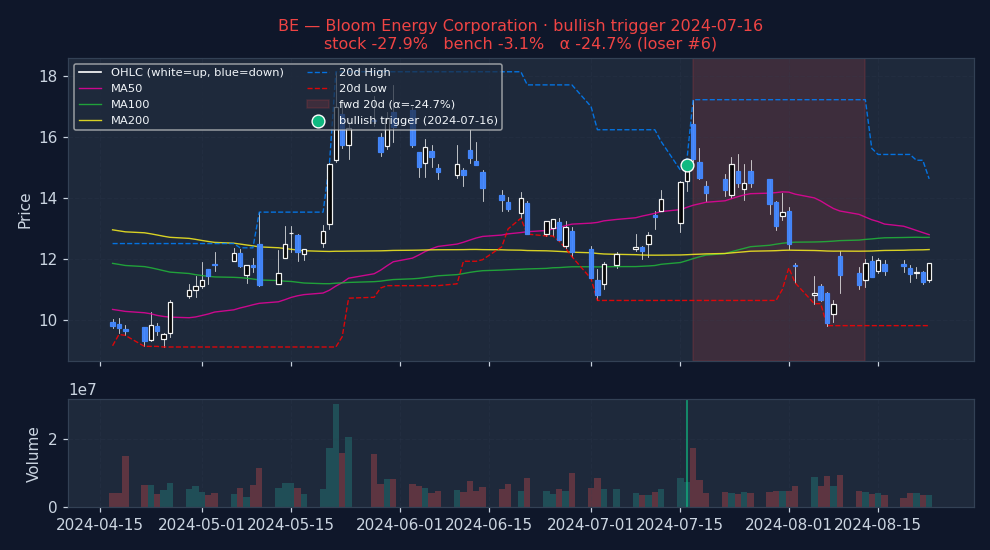
Example triggers on US large-caps (2023+, mcap ≥ $30B)
Six recent bullish NEW_20D_HIGH triggers on US mega-caps, filtered to |alpha| ≤ 25% to exclude catalyst-driven outliers (earnings surprises, M&A, binary events). The first three are the strongest outcomes — what the signal looks like when it works. The last three are the weakest — what the signal looks like when it fails. Each chart shows the stock's price with signal-appropriate technical overlays (e.g. MACD subpanel on MACD pages, Bollinger Bands on Bollinger pages, the 52-week trailing max line on 52w-high pages), a dot marking the trigger date, and the forward window shaded (green when the signal was right, red when it wasn't). Click any chart to open full-size.
Strongest outcomes (what NEW_20D_HIGH looks like when it works)
Weakest outcomes (what NEW_20D_HIGH looks like when it fails)
Stock-regime quadrants (2×2 per-stock, 20d alpha detail table)
| Quadrant | N | Stock % (spx) | Bench % (spx) | Alpha % (spx) | p (HAC) | Stock % (msci) | Bench % (msci) | Alpha % (msci) | p (HAC) | Stock % (spxew) | Bench % (spxew) | Alpha % (spxew) | p (HAC) |
|---|---|---|---|---|---|---|---|---|---|---|---|---|---|
| Trending + Low vol Clean directional grind, low whipsaw | 103,529 | +0.38% | +0.64% | -0.18% | 0.0004 | +0.38% | +0.49% | -0.02% | 0.6893 | +0.38% | +0.35% | +0.12% | 0.0145 |
| Trending + High vol Crisis selloff or parabolic rally | 204,870 | +0.37% | +1.02% | -0.60% | <0.001 | +0.37% | +0.91% | -0.48% | <0.001 | +0.37% | +0.80% | -0.35% | <0.001 |
| Non-trending + Low vol Quiet chop, summer doldrums | 89,101 | +0.39% | +0.66% | -0.25% | <0.001 | +0.39% | +0.48% | -0.07% | 0.0679 | +0.39% | +0.37% | +0.06% | 0.1534 |
| Non-trending + High vol Classical "whipsaw zone" for momentum | 266,534 | +0.68% | +0.99% | -0.27% | <0.001 | +0.68% | +0.89% | -0.17% | <0.001 | +0.68% | +0.83% | -0.10% | 0.0097 |
Sub-period breakdown table (20d alpha)
| Period | N | Alpha % (spx) | p (HAC) | Alpha % (msci) | p (HAC) | Alpha % (spxew) | p (HAC) |
|---|---|---|---|---|---|---|---|
| 2015-2019 2015-01-01 → 2020-01-01 | 218,711 | -0.52% | <0.001 | -0.33% | <0.001 | -0.22% | <0.001 |
| 2020-2022 2020-01-01 → 2023-01-01 | 196,025 | -0.18% | 0.0011 | -0.09% | 0.1195 | -0.32% | <0.001 |
| 2023-2026 2023-01-01 → 2099-01-01 | 250,208 | -0.38% | <0.001 | -0.28% | <0.001 | +0.08% | 0.1034 |
Methodology and caveats
How to read. Entry at open of T+1 (one trading day after the signal fires on close of T). 20d = open T+1 to close T+20. Alpha = stock return − benchmark return over the same window (Convention A, single-sided, textbook). For bullish triggers, POSITIVE alpha = signal was right. For bearish triggers, NEGATIVE alpha = signal was right (stock underperformed market). No sign-flipping; the direction of the bet determines what "good" looks like. Per-stock regime is each stock's own ADX(14) and RV(20) at the trigger date — not market-wide state.
Three p-values, three robustness tests. (a) p_naive: scipy one-sample t-test on winsorized alphas. Optimistic because overlapping 20d windows on the same ticker inflate effective N. (b) p_hac: Newey-West HAC with lag = horizon — corrects for the overlap and is the academic-finance standard. (c) p_perm: fraction of 200 random-date null iterations with mean ≥ observed. Tests whether the signal beats random date selection at all. A signal that clears all three (pnaive, phac, pperm all < 0.05) has real information; a signal that fails pperm has zero edge even if the t-test says "significant."
Caveats. (i) Universe reflects today's active tickers; delisted losers pruned → survivorship bias. (ii) Mcap ≥ $100M filter uses today's snapshot, not point-in-time — mild lookahead on which stocks enter the sample, not on returns. (iii) Means and p-values use winsorized alphas (1/99 percentile) to prevent data errors from dominating. Medians and hit rates use raw data. (iv) Zero transaction costs assumed. Realistic bid-ask + commissions remove 20–40bps from 20d alpha on US large-caps, more on small-cap. Sub-20bps alpha is noise in practice. (v) Past performance does not predict future results.
How to use this
1 · When to reach for this signal
Caution recommended. Bullish 20d alpha is -0.37% and worse than random — triggering on random dates would have produced better long-side returns. Either direction fails the "beats random" test. Don't use 20-Day New High as a standalone entry trigger. It may still be useful as part of a composite (section 4).
2 · When it works — the setups that drive it
- Best bullish setup: Trending + Low vol — alpha -0.18% / 20d on 103,529 historical triggers.
- Best era for bullish: 2020-2022 — alpha -0.18% / 20d.
3 · When it fails — common false positives
- Weakest bullish cell: Trending + High vol — alpha -0.60% / 20d on 204,870 triggers.
- Worst era for bullish: 2015-2019 — alpha -0.52% / 20d.
Signal-specific failure patterns
4 · Pairing inside a screen
The statements below describe how this signal relates to others by construction — which indicator family it belongs to, and where same-family redundancy might reduce the independence of evidence inside a Daily Report. These are taxonomic classifications drawn from standard technical-analysis texts; they are not pairing backtests. A multi-signal convergence backtest is planned but not yet run.
Breakout-family redundancy
New 20-day high, new 52-week high, and fresh 52-week high are breakout signals at different lookbacks — all fire when price exceeds the maximum of the prior N bars (Edwards & Magee, Technical Analysis of Stock Trends, 11th ed. 2018; Kirkpatrick & Dahlquist, Technical Analysis, 3rd ed. 2015; Bulkowski, Encyclopedia of Chart Patterns, 3rd ed. 2021). Stacking two or more in the same direction within a single Daily Report produces correlated rather than independent evidence.
What would likely rescue this signal
This block calls out the data or conditions that could turn a technically weak signal into a usable one in a composite screen. Based on signal mechanics and the observed failure patterns above; individual combinations are not yet backtested.
- Volume-filter to cut the 10x trigger noise — Fresh 20d highs are too common. Requiring volume > 1.5-2× the 20d average would reduce triggers by 60-80% and concentrate on real accumulation events. Untested individually but consistent with textbook breakout logic.
- Combine with structural-breakout level — A 20d high that's ALSO a 52w high / multi-year resistance break is a structurally different event than a 20d high inside a sideways range. Compound filter should concentrate the alpha.
See also Why technical-only signals don't survive on their own for the broader argument.
5 · Before you act — a 5-point checklist
- Normal trading day? Rule out earnings (within ±3 days), ex-dividend, or known corporate-action dates — the signal is almost certainly reading noise, not momentum, in those windows.
- Where is price vs its own 50 / 200 DMA? A trend signal is only as credible as the underlying trend it claims to confirm. Check the 200DMA orientation before acting.
- What's the sector breadth doing? An isolated signal in a broadly down-trending sector is a lower-confidence setup than one firing with the rest of its peer group.
- Is ADV20 enough for your size? If the trigger is on a $500M name and you want to move $1M notional, you're the tape. Consider adv20d ≥ 5% of your intended position.
- What invalidates you? Define a price level (for longs: a close below the trigger-day low; for shorts: close above the trigger-day high) and honor it. The backtest alpha is an average; any one trade can be at either tail.
Execution notes
Useful primarily as a SCREEN FILTER — 'stocks making 20d new highs' is a reasonable universe shortcut, but the raw signal as an entry trigger is a loser. Entry open T+1. Skip as a primary trigger on US large-caps; if used, pair with volume + mcap filters to cut the triggerfire rate 10x.