hh_hl_structure
HH/HL Trend Structure
Detects trend structure shifts using swing highs and lows. Bullish: last two swing highs form a Higher High (exceeding z-score tolerance), then price pulls back to form a Higher Low above the previous swing low, confirmed after 5 bars. Bearish is the mirror (Lower Low + Lower High). Z-score tolerance adapts to each stock's volatility — tighter for low-vol, looser for high-vol stocks.
Signal family
Pattern — Formal chart-pattern detectors (double tops / bottoms, failed breakouts, HH/HL structure).
Parameters
| Name | Description | Default | Range |
|---|---|---|---|
| swing_window | Swing detection window (bars each side) | 10 | 3–30 |
| confirmation_window | Confirmation window for forming HL/LH | 1 | 1–15 |
| tolerance_zscore | Min HH/LL move (z-scores of daily vol) | 1.5 | 0.5–4.0 |
| vol_window | Volatility computation window | 252 | 60–504 |
| lookback | Lookback window (bars) | 252 | 60–504 |
Historical context
94,995 valid triggers on 3,320 distinct tickers between 2015-11-02 and 2026-04-21. Universe: us_only · mcap ≥ $100,000,000 · price ≥ $1 (3,322 tickers). Entry at open T+1. 1d = intraday T+1; 20d = open T+1 to close T+20.
Benchmarks: spxew (S&P 500 Equal Weight — the primary benchmark here; a median-stock view that avoids the 2020+ megacap-concentration distortion), spx (S&P 500, cap-weighted), and msci (MSCI World USD). Per-stock regime: trending = ADX(14) ≥ 25, high vol = 20d ann. vol ≥ 20%.
At a glance (20d alpha vs S&P 500 Equal Weight, US-only)
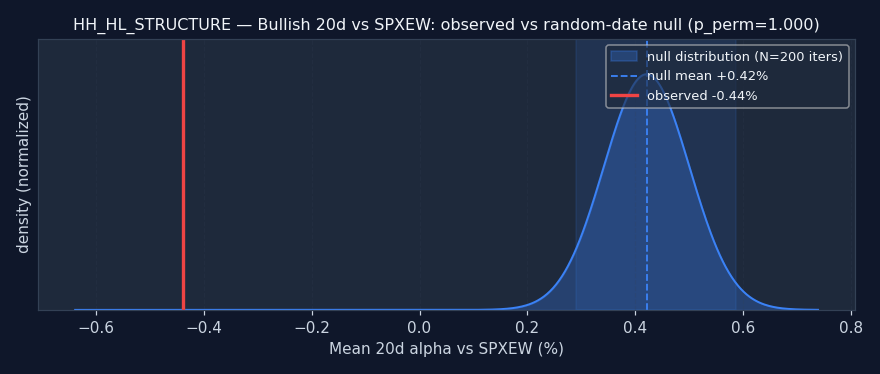
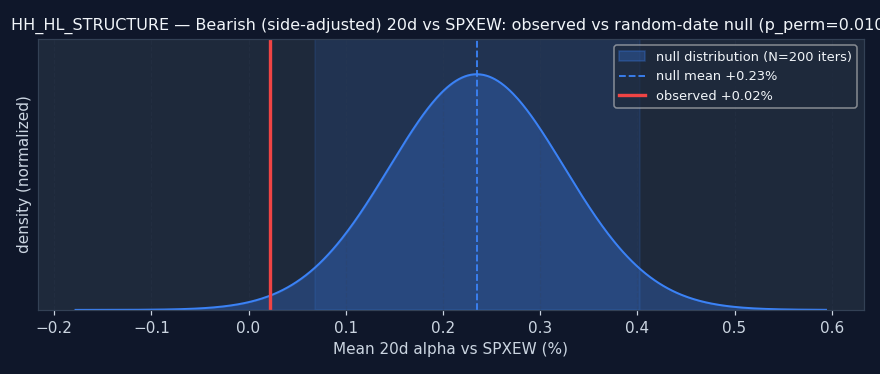
Reading this: the random-date null is: for each ticker, sample N random dates and compute the same alpha — what alpha does a signal with no information produce? If the signal's observed alpha beats the null (pperm≤0.05), it's adding real information. If it's inside or worse than the null, the signal doesn't add value over random firing — any observed alpha is either noise or a universe artifact.
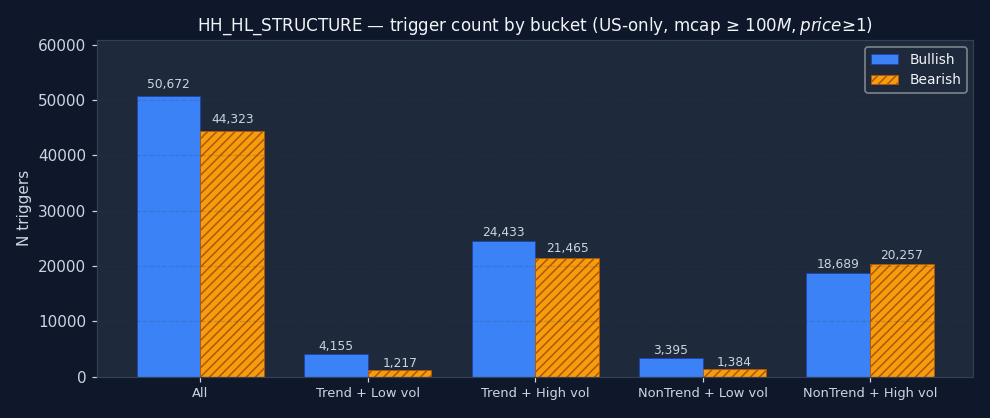
How often does HH_HL_STRUCTURE fire in each regime?
The signal's bucket distribution is itself informative. If 50%+ of all HH_HL_STRUCTURE triggers fire in the "non-trending + high vol" quadrant, the signal is structurally a chop-market event — regardless of what its textbook definition claims. Bullish and bearish are shown separately; counts are across the full US-only sample after the mcap and price floor.
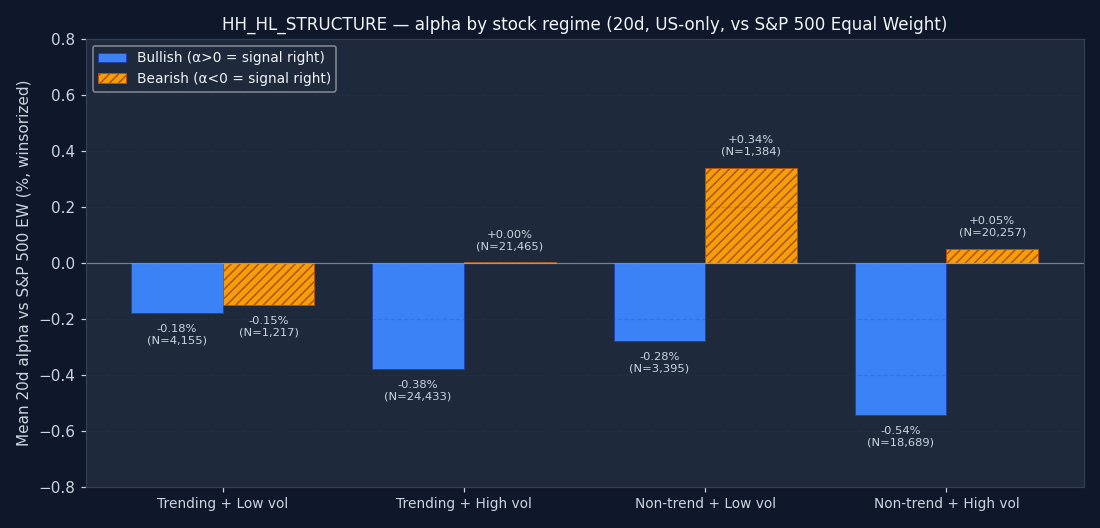
Per-stock regime quadrant — 20d alpha
Each trigger is tagged with the host stock's own technical regime on the trigger date: is the stock itself in a trend (ADX(14) ≥ 25) or ranging? And is its realized 20-day volatility high (≥ 20% annualized) or low? This is the textbook conditioning variable — "does this signal work better in trending stocks?" — answered at the level of the individual stock, not the market. Positive bars are good for the signal; negative bars mean alpha vanishes into the benchmark or worse.
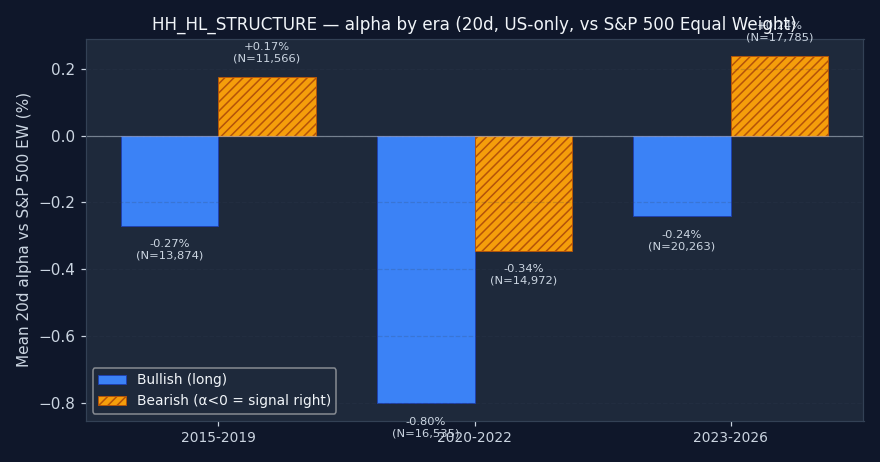
Sub-period check — does the signal work in every era?
A multi-year average can hide major instability. We split the sample into three non-overlapping windows: 2015–2019 (pre-COVID, normalized monetary policy), 2020–2022 (pandemic crash + recovery + rate-shock bear), and 2023+ (post-ZIRP, AI megacap rally). If a signal's alpha is positive overall but comes entirely from one era, that's a red flag — the conditions that produced it may not repeat. A robust signal shows a consistent sign across all non-empty buckets.
↑ Bullish triggers
| Bench | Metric | 1d | 5d | 20d | 60d | 252d |
|---|---|---|---|---|---|---|
| spx | Stock % | +0.07% | -0.12% | +0.06% | +2.00% | +11.24% |
| Bench % | +0.00% | +0.26% | +0.86% | +2.89% | +13.34% | |
| Alpha % | +0.06% | -0.36% | -0.76% | -0.85% | -2.04% | |
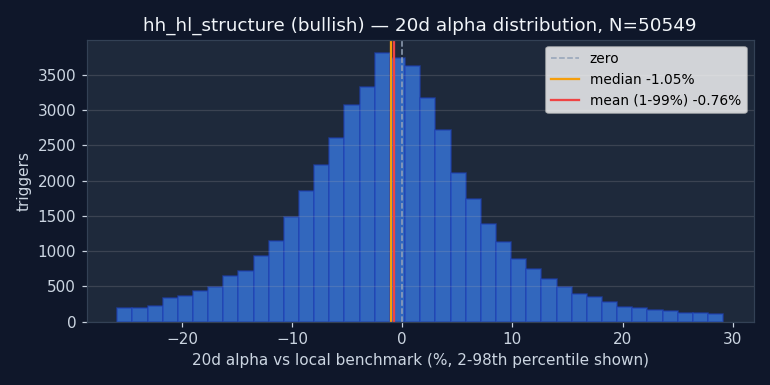
| Median alpha | +0.02% | -0.32% | -1.05% | -2.23% | -8.29% | |
| Hit rate (α>0) | 50.8% | 45.9% | 44.4% | 43.9% | 39.9% | |
| p (naive) | <0.001 | <0.001 | <0.001 | <0.001 | <0.001 | |
| p (HAC) | <0.001 | <0.001 | <0.001 | <0.001 | <0.001 | |
| N | 50,655 | 50,624 | 50,549 | 49,086 | 43,998 | |
| msci | Stock % | +0.07% | -0.12% | +0.06% | +2.00% | +11.24% |
| Bench % | +0.07% | +0.28% | +0.78% | +2.54% | +10.88% | |
| Alpha % | -0.00% | -0.39% | -0.69% | -0.47% | +0.48% | |
| Median alpha | -0.04% | -0.35% | -1.01% | -1.85% | -5.55% | |
| Hit rate (α>0) | 48.8% | 45.5% | 44.4% | 44.9% | 42.9% | |
| p (naive) | 0.8800 | <0.001 | <0.001 | <0.001 | 0.0319 | |
| p (HAC) | 0.8800 | <0.001 | <0.001 | <0.001 | 0.2246 | |
| N | 50,574 | 50,465 | 50,331 | 48,885 | 43,871 | |
| spxew | Stock % | +0.07% | -0.12% | +0.06% | +2.00% | +11.24% |
| Bench % | +0.04% | +0.19% | +0.57% | +2.14% | +9.59% | |
| Alpha % | +0.01% | -0.29% | -0.44% | -0.06% | +1.81% | |
| Median alpha | -0.02% | -0.24% | -0.73% | -1.41% | -4.56% | |
| Hit rate (α>0) | 49.5% | 46.9% | 46.0% | 46.1% | 44.2% | |
| p (naive) | 0.1532 | <0.001 | <0.001 | 0.5169 | <0.001 | |
| p (HAC) | 0.1537 | <0.001 | <0.001 | 0.5666 | <0.001 | |
| N | 50,460 | 50,128 | 50,167 | 48,749 | 43,604 |
Permutation null detail — all horizons × both benchmarks
| Horizon | Bench | Observed α | Null mean | Null 95% CI | pperm |
|---|---|---|---|---|---|
| 1d | spx | +0.06% | -0.01% | [-0.04%, +0.01%] | 0.005 |
| 1d | msci | -0.00% | -0.03% | [-0.06%, -0.01%] | 0.010 |
| 1d | spxew | +0.01% | -0.03% | [-0.06%, -0.01%] | 0.005 |
| 5d | spx | -0.36% | +0.05% | [-0.02%, +0.14%] | 1.000 |
| 5d | msci | -0.39% | +0.06% | [-0.02%, +0.15%] | 1.000 |
| 5d | spxew | -0.29% | +0.08% | [+0.00%, +0.16%] | 1.000 |
| 20d | spx | -0.76% | +0.23% | [+0.10%, +0.40%] | 1.000 |
| 20d | msci | -0.69% | +0.35% | [+0.22%, +0.52%] | 1.000 |
| 20d | spxew | -0.44% | +0.42% | [+0.29%, +0.59%] | 1.000 |
| 60d | spx | -0.85% | +0.71% | [+0.46%, +1.00%] | 1.000 |
| 60d | msci | -0.47% | +1.15% | [+0.92%, +1.45%] | 1.000 |
| 60d | spxew | -0.06% | +1.38% | [+1.13%, +1.69%] | 1.000 |
| 252d | spx | -2.04% | +2.75% | [+1.93%, +3.70%] | 1.000 |
| 252d | msci | +0.48% | +5.08% | [+4.26%, +6.01%] | 1.000 |
| 252d | spxew | +1.81% | +6.40% | [+5.61%, +7.35%] | 1.000 |
Example triggers on US large-caps (2023+, mcap ≥ $30B)
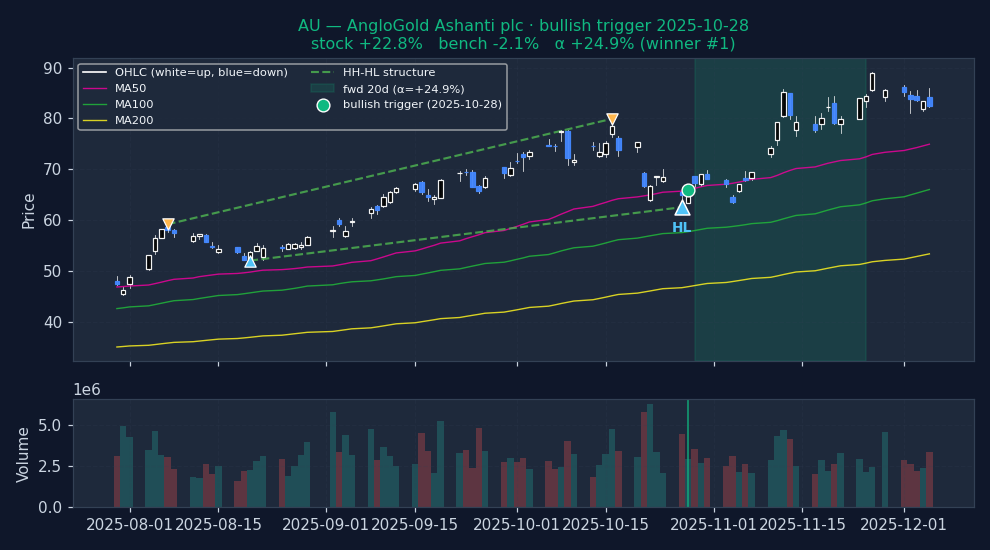
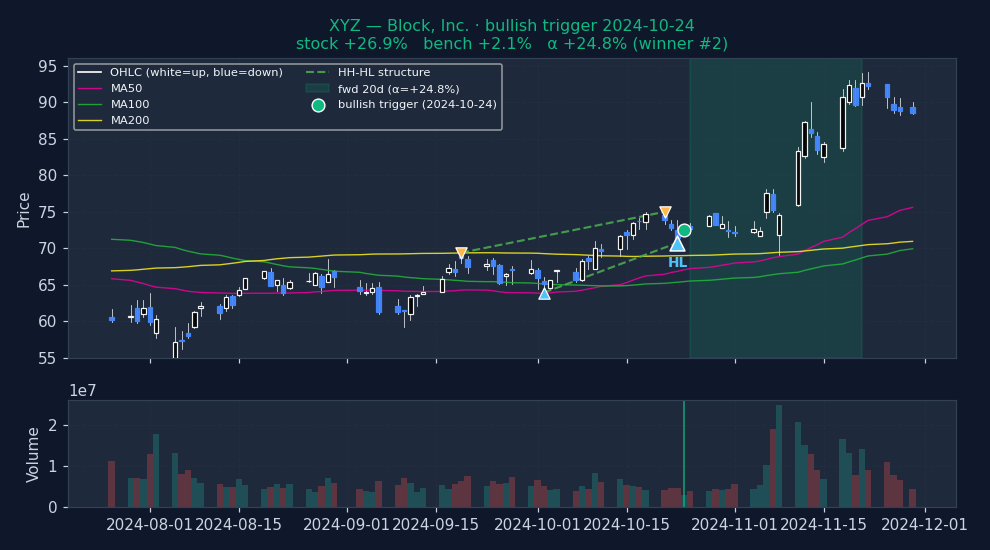
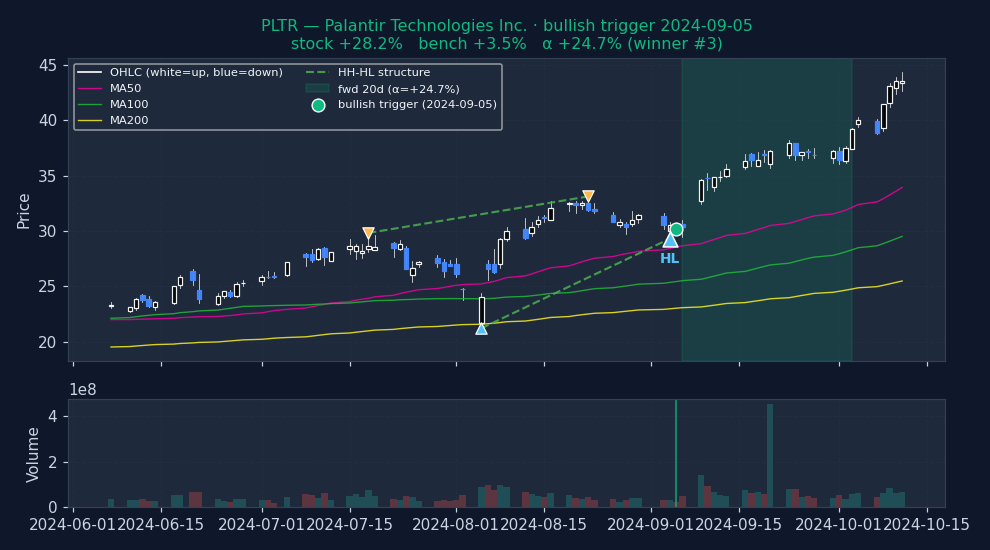
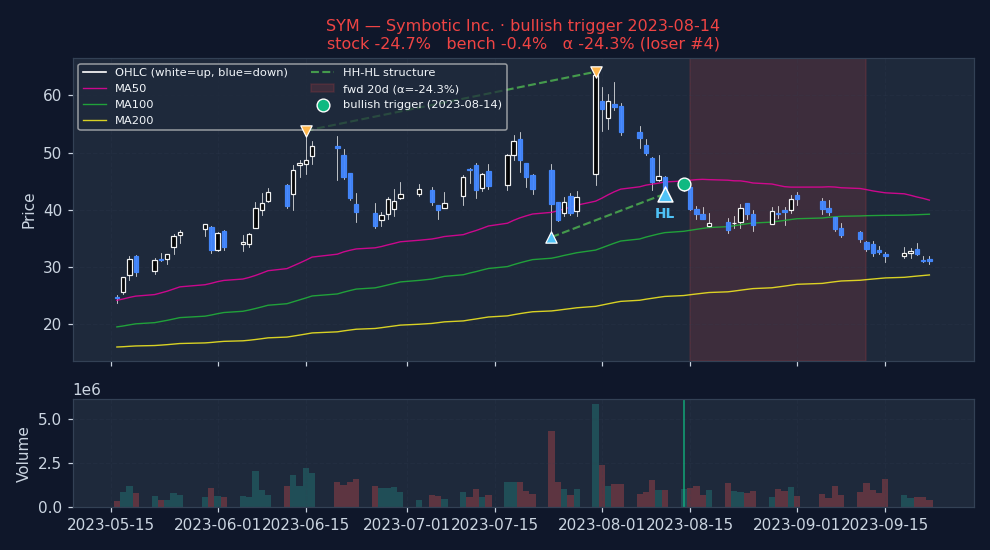
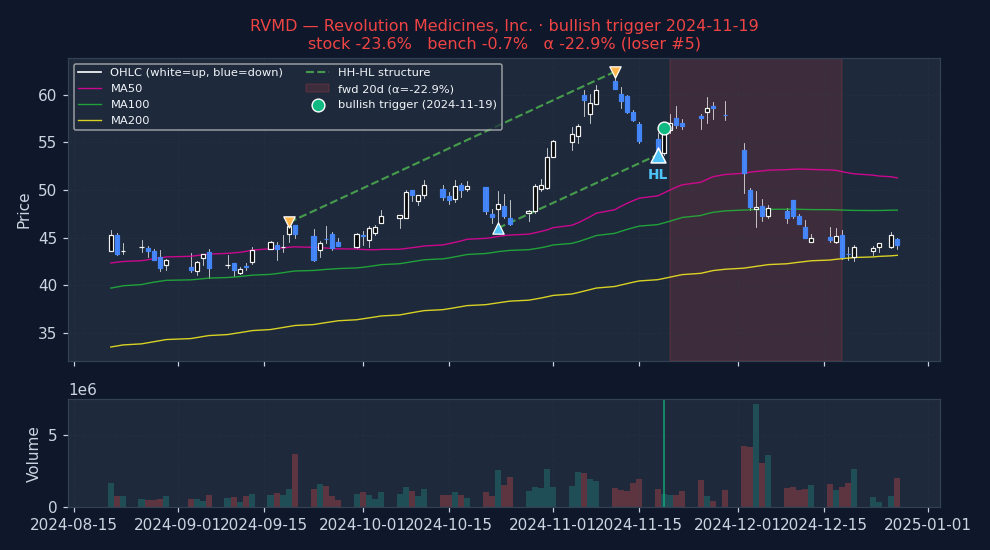
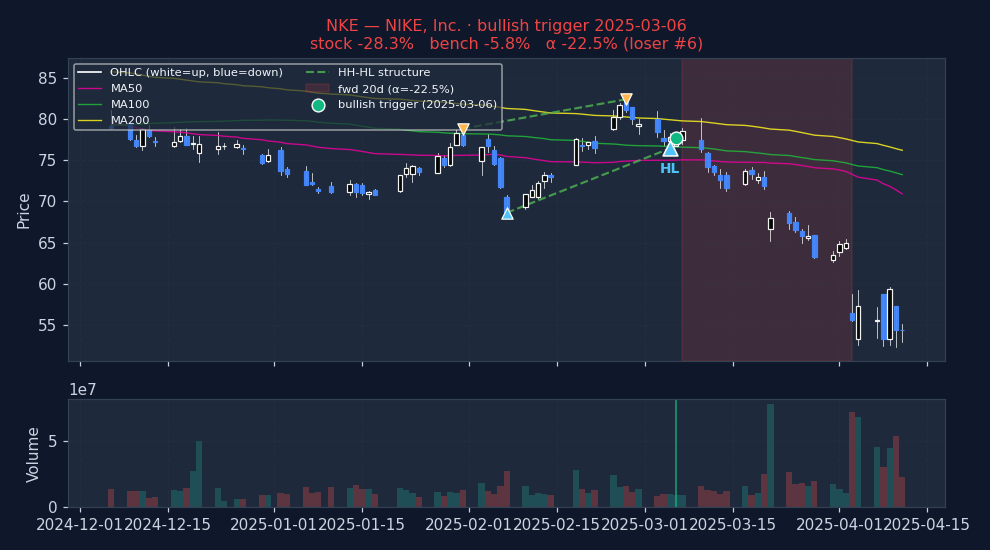
Six recent bullish HH_HL_STRUCTURE triggers on US mega-caps, filtered to |alpha| ≤ 25% to exclude catalyst-driven outliers (earnings surprises, M&A, binary events). The first three are the strongest outcomes — what the signal looks like when it works. The last three are the weakest — what the signal looks like when it fails. Each chart shows the stock's price with signal-appropriate technical overlays (e.g. MACD subpanel on MACD pages, Bollinger Bands on Bollinger pages, the 52-week trailing max line on 52w-high pages), a dot marking the trigger date, and the forward window shaded (green when the signal was right, red when it wasn't). Click any chart to open full-size.
Strongest outcomes (what HH_HL_STRUCTURE looks like when it works)
Weakest outcomes (what HH_HL_STRUCTURE looks like when it fails)
Stock-regime quadrants (2×2 per-stock, 20d alpha detail table)
| Quadrant | N | Stock % (spx) | Bench % (spx) | Alpha % (spx) | p (HAC) | Stock % (msci) | Bench % (msci) | Alpha % (msci) | p (HAC) | Stock % (spxew) | Bench % (spxew) | Alpha % (spxew) | p (HAC) |
|---|---|---|---|---|---|---|---|---|---|---|---|---|---|
| Trending + Low vol Clean directional grind, low whipsaw | 4,155 | -0.20% | +0.41% | -0.61% | <0.001 | -0.20% | +0.28% | -0.46% | <0.001 | -0.20% | +0.01% | -0.18% | 0.0258 |
| Trending + High vol Crisis selloff or parabolic rally | 24,433 | +0.15% | +0.93% | -0.71% | <0.001 | +0.15% | +0.83% | -0.63% | <0.001 | +0.15% | +0.64% | -0.38% | <0.001 |
| Non-trending + Low vol Quiet chop, summer doldrums | 3,395 | -0.12% | +0.57% | -0.68% | <0.001 | -0.12% | +0.41% | -0.52% | <0.001 | -0.12% | +0.18% | -0.28% | 0.0036 |
| Non-trending + High vol Classical "whipsaw zone" for momentum | 18,689 | +0.10% | +0.92% | -0.78% | <0.001 | +0.10% | +0.89% | -0.78% | <0.001 | +0.10% | +0.71% | -0.54% | <0.001 |
Sub-period breakdown table (20d alpha)
| Period | N | Alpha % (spx) | p (HAC) | Alpha % (msci) | p (HAC) | Alpha % (spxew) | p (HAC) |
|---|---|---|---|---|---|---|---|
| 2015-2019 2015-01-01 → 2020-01-01 | 13,874 | -0.55% | <0.001 | -0.41% | <0.001 | -0.27% | 0.0003 |
| 2020-2022 2020-01-01 → 2023-01-01 | 16,535 | -0.66% | <0.001 | -0.67% | <0.001 | -0.80% | <0.001 |
| 2023-2026 2023-01-01 → 2099-01-01 | 20,263 | -0.97% | <0.001 | -0.89% | <0.001 | -0.24% | 0.0073 |
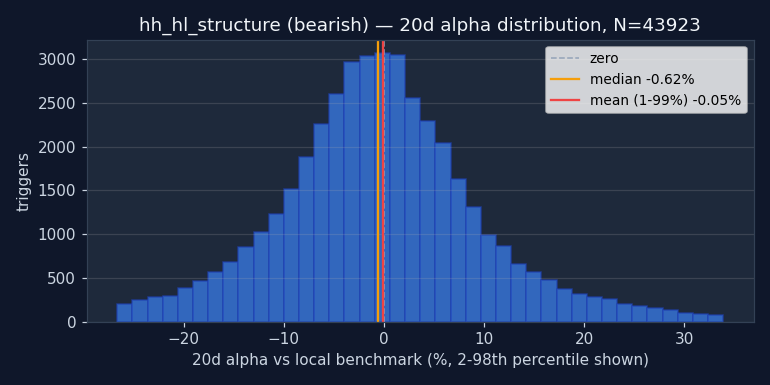
↓ Bearish triggers negative alpha = signal was right (stock underperformed market)
| Bench | Metric | 1d | 5d | 20d | 60d | 252d |
|---|---|---|---|---|---|---|
| spx | Stock % | -0.18% | +0.21% | +1.45% | +4.32% | +14.33% |
| Bench % | +0.11% | +0.45% | +1.56% | +4.16% | +15.09% | |
| Alpha % | -0.29% | -0.25% | -0.05% | +0.16% | -0.71% | |
| Median alpha | -0.22% | -0.36% | -0.62% | -1.57% | -9.27% | |
| Hit rate (α>0) | 44.0% | 46.2% | 47.2% | 46.1% | 39.7% | |
| p (naive) | <0.001 | <0.001 | 0.3577 | 0.1453 | 0.0116 | |
| p (HAC) | <0.001 | <0.001 | 0.3650 | 0.1993 | 0.1550 | |
| N | 44,302 | 44,178 | 43,923 | 43,076 | 39,306 | |
| msci | Stock % | -0.18% | +0.21% | +1.45% | +4.32% | +14.33% |
| Bench % | +0.05% | +0.40% | +1.36% | +3.74% | +12.98% | |
| Alpha % | -0.24% | -0.19% | +0.19% | +0.65% | +1.38% | |
| Median alpha | -0.20% | -0.31% | -0.41% | -1.11% | -7.11% | |
| Hit rate (α>0) | 45.2% | 46.8% | 48.2% | 47.3% | 42.0% | |
| p (naive) | <0.001 | <0.001 | 0.0016 | <0.001 | <0.001 | |
| p (HAC) | <0.001 | <0.001 | 0.0018 | <0.001 | 0.0063 | |
| N | 43,946 | 43,716 | 43,423 | 42,655 | 38,763 | |
| spxew | Stock % | -0.18% | +0.21% | +1.45% | +4.32% | +14.33% |
| Bench % | +0.07% | +0.46% | +1.52% | +3.70% | +11.78% | |
| Alpha % | -0.25% | -0.23% | +0.02% | +0.67% | +2.72% | |
| Median alpha | -0.18% | -0.33% | -0.50% | -1.08% | -5.66% | |
| Hit rate (α>0) | 45.4% | 46.5% | 47.6% | 47.3% | 43.2% | |
| p (naive) | <0.001 | <0.001 | 0.7167 | <0.001 | <0.001 | |
| p (HAC) | <0.001 | <0.001 | 0.7208 | <0.001 | <0.001 | |
| N | 43,967 | 43,422 | 43,296 | 42,349 | 38,863 |
Permutation null detail — all horizons × both benchmarks
| Horizon | Bench | Observed α | Null mean | Null 95% CI | pperm |
|---|---|---|---|---|---|
| 1d | spx | -0.29% | -0.03% | [-0.05%, -0.00%] | 0.005 |
| 1d | msci | -0.24% | -0.05% | [-0.08%, -0.02%] | 0.005 |
| 1d | spxew | -0.25% | -0.05% | [-0.08%, -0.03%] | 0.005 |
| 5d | spx | -0.25% | -0.00% | [-0.09%, +0.08%] | 0.005 |
| 5d | msci | -0.19% | +0.00% | [-0.08%, +0.09%] | 0.005 |
| 5d | spxew | -0.23% | +0.02% | [-0.06%, +0.11%] | 0.005 |
| 20d | spx | -0.05% | +0.04% | [-0.13%, +0.20%] | 0.149 |
| 20d | msci | +0.19% | +0.16% | [-0.01%, +0.34%] | 0.592 |
| 20d | spxew | +0.02% | +0.23% | [+0.07%, +0.40%] | 0.010 |
| 60d | spx | +0.16% | +0.08% | [-0.22%, +0.42%] | 0.741 |
| 60d | msci | +0.65% | +0.52% | [+0.21%, +0.85%] | 0.806 |
| 60d | spxew | +0.67% | +0.75% | [+0.44%, +1.08%] | 0.328 |
| 252d | spx | -0.71% | +0.16% | [-0.64%, +1.04%] | 0.020 |
| 252d | msci | +1.38% | +2.48% | [+1.66%, +3.41%] | 0.015 |
| 252d | spxew | +2.72% | +3.86% | [+3.08%, +4.68%] | 0.005 |
Example triggers on US large-caps (2023+, mcap ≥ $30B)
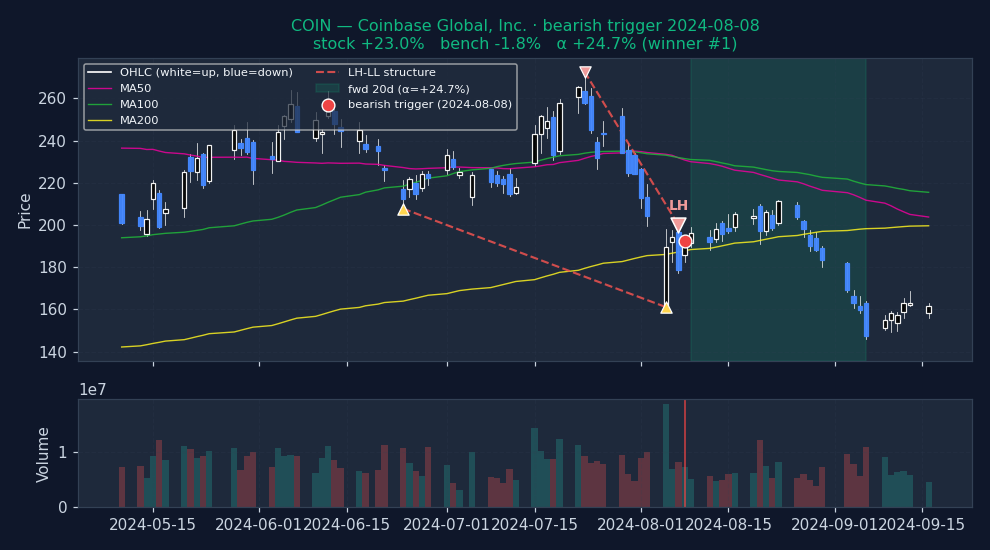
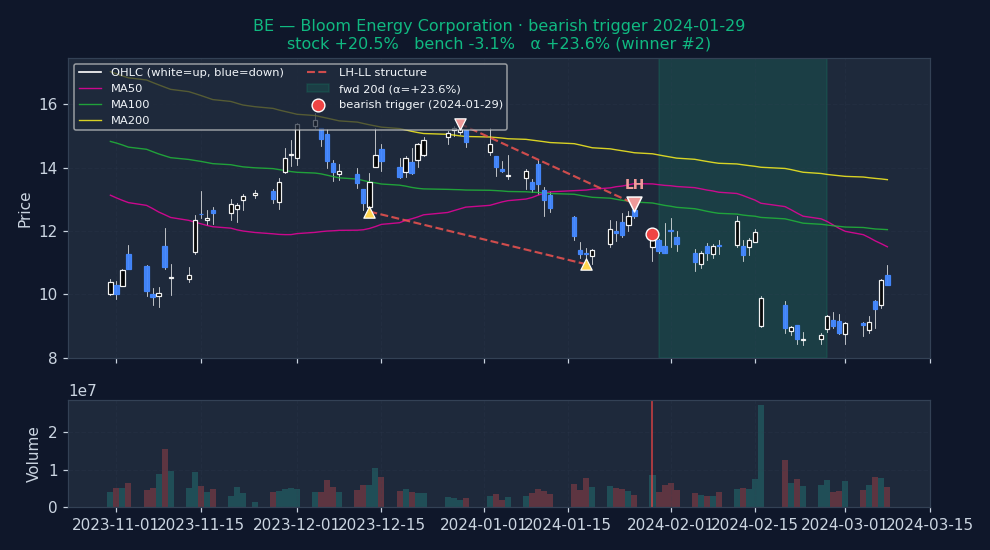
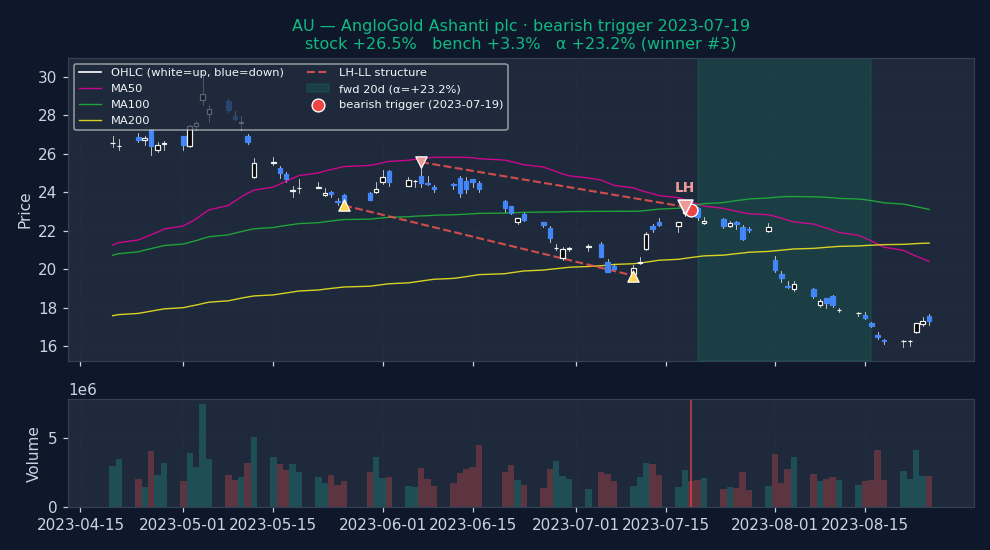
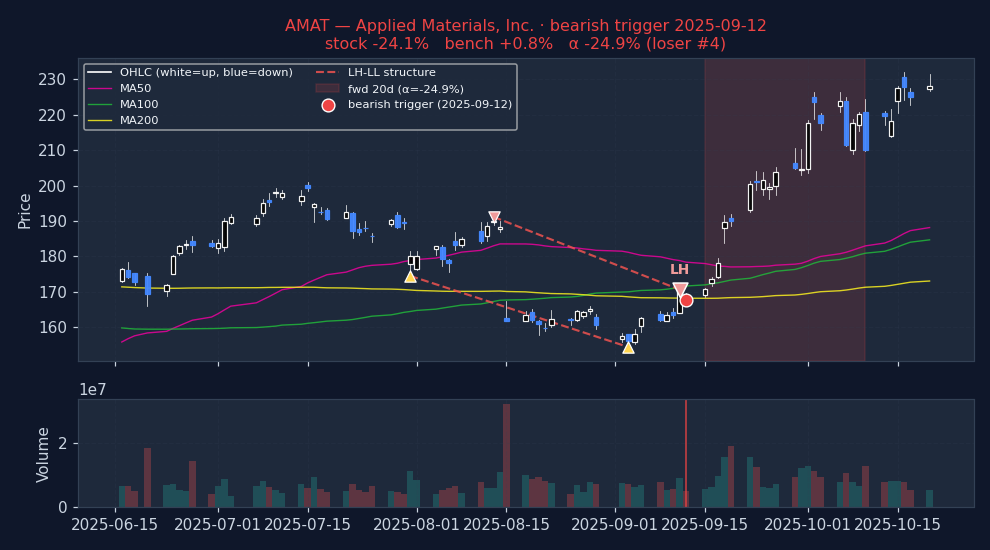
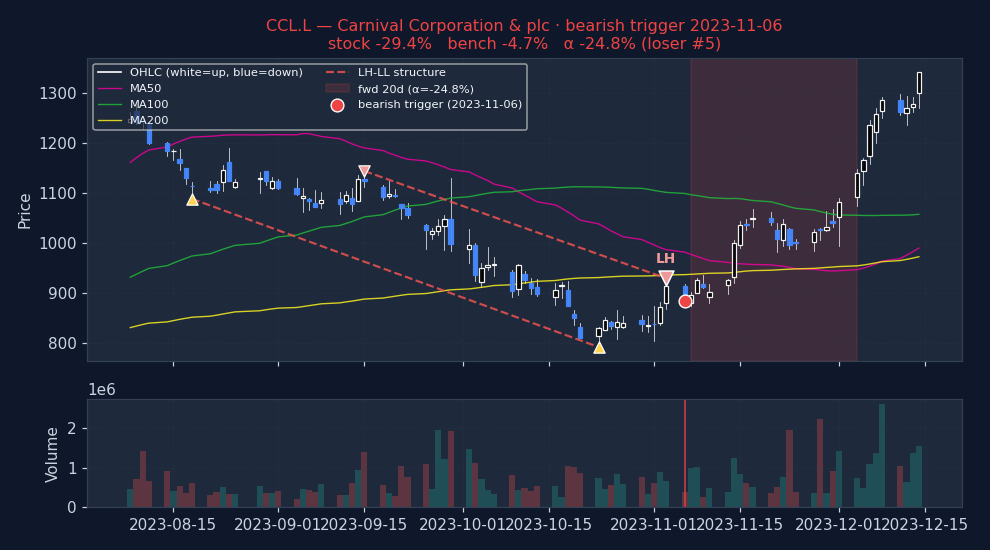
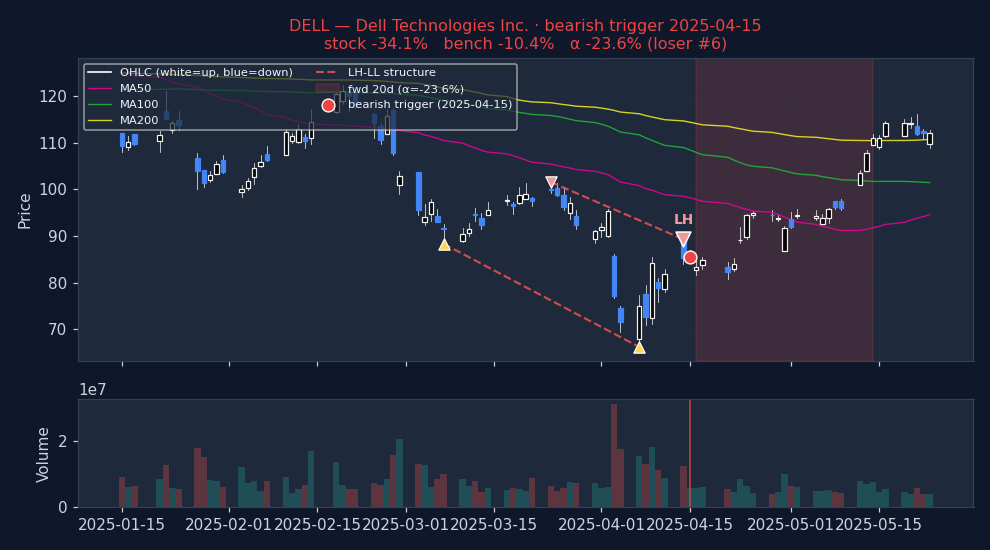
Six recent bearish HH_HL_STRUCTURE triggers on US mega-caps, filtered to |alpha| ≤ 25% to exclude catalyst-driven outliers (earnings surprises, M&A, binary events). The first three are the strongest outcomes — what the signal looks like when it works. The last three are the weakest — what the signal looks like when it fails. Each chart shows the stock's price with signal-appropriate technical overlays (e.g. MACD subpanel on MACD pages, Bollinger Bands on Bollinger pages, the 52-week trailing max line on 52w-high pages), a dot marking the trigger date, and the forward window shaded (green when the signal was right, red when it wasn't). Click any chart to open full-size.
Strongest outcomes (what HH_HL_STRUCTURE looks like when it works)
Weakest outcomes (what HH_HL_STRUCTURE looks like when it fails)
Stock-regime quadrants (2×2 per-stock, 20d alpha detail table)
| Quadrant | N | Stock % (spx) | Bench % (spx) | Alpha % (spx) | p (HAC) | Stock % (msci) | Bench % (msci) | Alpha % (msci) | p (HAC) | Stock % (spxew) | Bench % (spxew) | Alpha % (spxew) | p (HAC) |
|---|---|---|---|---|---|---|---|---|---|---|---|---|---|
| Trending + Low vol Clean directional grind, low whipsaw | 1,217 | +0.20% | +0.71% | -0.47% | 0.0087 | +0.20% | +0.51% | -0.25% | 0.1673 | +0.20% | +0.41% | -0.15% | 0.3929 |
| Trending + High vol Crisis selloff or parabolic rally | 21,465 | +1.90% | +2.01% | -0.05% | 0.6018 | +1.90% | +1.74% | +0.26% | 0.0044 | +1.90% | +2.03% | +0.00% | 0.9949 |
| Non-trending + Low vol Quiet chop, summer doldrums | 1,384 | +0.63% | +0.68% | +0.01% | 0.9501 | +0.63% | +0.47% | +0.22% | 0.1447 | +0.63% | +0.43% | +0.34% | 0.0224 |
| Non-trending + High vol Classical "whipsaw zone" for momentum | 20,257 | +1.11% | +1.17% | -0.03% | 0.7188 | +1.11% | +1.05% | +0.14% | 0.1133 | +1.11% | +1.14% | +0.05% | 0.5866 |
Sub-period breakdown table (20d alpha)
| Period | N | Alpha % (spx) | p (HAC) | Alpha % (msci) | p (HAC) | Alpha % (spxew) | p (HAC) |
|---|---|---|---|---|---|---|---|
| 2015-2019 2015-01-01 → 2020-01-01 | 11,566 | +0.17% | 0.0619 | +0.43% | <0.001 | +0.17% | 0.0569 |
| 2020-2022 2020-01-01 → 2023-01-01 | 14,972 | -0.10% | 0.3589 | +0.40% | 0.0004 | -0.34% | 0.0020 |
| 2023-2026 2023-01-01 → 2099-01-01 | 17,785 | -0.17% | 0.0819 | -0.16% | 0.1140 | +0.24% | 0.0159 |
Methodology and caveats
How to read. Entry at open of T+1 (one trading day after the signal fires on close of T). 20d = open T+1 to close T+20. Alpha = stock return − benchmark return over the same window (Convention A, single-sided, textbook). For bullish triggers, POSITIVE alpha = signal was right. For bearish triggers, NEGATIVE alpha = signal was right (stock underperformed market). No sign-flipping; the direction of the bet determines what "good" looks like. Per-stock regime is each stock's own ADX(14) and RV(20) at the trigger date — not market-wide state.
Three p-values, three robustness tests. (a) p_naive: scipy one-sample t-test on winsorized alphas. Optimistic because overlapping 20d windows on the same ticker inflate effective N. (b) p_hac: Newey-West HAC with lag = horizon — corrects for the overlap and is the academic-finance standard. (c) p_perm: fraction of 200 random-date null iterations with mean ≥ observed. Tests whether the signal beats random date selection at all. A signal that clears all three (pnaive, phac, pperm all < 0.05) has real information; a signal that fails pperm has zero edge even if the t-test says "significant."
Caveats. (i) Universe reflects today's active tickers; delisted losers pruned → survivorship bias. (ii) Mcap ≥ $100M filter uses today's snapshot, not point-in-time — mild lookahead on which stocks enter the sample, not on returns. (iii) Means and p-values use winsorized alphas (1/99 percentile) to prevent data errors from dominating. Medians and hit rates use raw data. (iv) Zero transaction costs assumed. Realistic bid-ask + commissions remove 20–40bps from 20d alpha on US large-caps, more on small-cap. Sub-20bps alpha is noise in practice. (v) Past performance does not predict future results.
How to use this
1 · When to reach for this signal
Caution recommended. Bullish 20d alpha is -0.76% and worse than random — triggering on random dates would have produced better long-side returns. Either direction fails the "beats random" test. Don't use HH/HL Trend Structure as a standalone entry trigger. It may still be useful as part of a composite (section 4).
2 · When it works — the setups that drive it
- Best bullish setup: Trending + Low vol — alpha -0.61% / 20d on 4,155 historical triggers.
- Best bearish setup: Non-trending + Low vol — alpha +0.01% / 20d on 1,384 historical triggers.
- Best era for bullish: 2015-2019 — alpha -0.55% / 20d.
- Best era for bearish: 2015-2019 — alpha +0.17% / 20d.
3 · When it fails — common false positives
- Weakest bullish cell: Non-trending + High vol — alpha -0.78% / 20d on 18,689 triggers.
- Weakest bearish cell: Trending + Low vol — alpha -0.47% / 20d on 1,217 triggers.
- Worst era for bullish: 2023-2026 — alpha -0.97% / 20d.
- Worst era for bearish: 2023-2026 — alpha -0.17% / 20d.
Signal-specific failure patterns
4 · Pairing inside a screen
The statements below describe how this signal relates to others by construction — which indicator family it belongs to, and where same-family redundancy might reduce the independence of evidence inside a Daily Report. These are taxonomic classifications drawn from standard technical-analysis texts; they are not pairing backtests. A multi-signal convergence backtest is planned but not yet run.
Trend-structure family
Higher-high / higher-low structure encodes the classical Dow-theory definition of an uptrend — a price structure of successively higher swing highs and swing lows (Dow theory as presented in Murphy, Technical Analysis of the Financial Markets, 1999; Edwards & Magee, Technical Analysis of Stock Trends, 11th ed. 2018). This overlaps with HH/HL streak, moving-average crossover, and long-term trend-break signals, which infer the same trend state from different measurements.
What would likely rescue this signal
This block calls out the data or conditions that could turn a technically weak signal into a usable one in a composite screen. Based on signal mechanics and the observed failure patterns above; individual combinations are not yet backtested.
- Use as a regime classifier, not a trigger — HH/HL structure is better thought of as 'what kind of trend is this stock in' rather than 'should I buy/short now'. Apply as a filter to other signals.
- Early-trend bullish refinement — The signal is worse at 20d than it is at 1d. Subset to triggers within the first 3 months of trend formation (trendiness-days counter). Testable from the existing metadata if the signal stores swing dates.
See also Why technical-only signals don't survive on their own for the broader argument.
5 · Before you act — a 5-point checklist
- Normal trading day? Rule out earnings (within ±3 days), ex-dividend, or known corporate-action dates — the signal is almost certainly reading noise, not momentum, in those windows.
- Where is price vs its own 50 / 200 DMA? Pattern signals carry their own structural context; check that the implied support/resistance levels have historical relevance, not just the most-recent 3-month range.
- What's the sector breadth doing? An isolated signal in a broadly down-trending sector is a lower-confidence setup than one firing with the rest of its peer group.
- Is ADV20 enough for your size? If the trigger is on a $500M name and you want to move $1M notional, you're the tape. Consider adv20d ≥ 5% of your intended position.
- What invalidates you? Define a price level (for longs: a close below the trigger-day low; for shorts: close above the trigger-day high) and honor it. The backtest alpha is an average; any one trade can be at either tail.
Execution notes
Neither direction tradable on its own under the current design. Bullish is a structural loser regardless of sub-period; bearish is noise. Best use: as a REGIME FILTER for other signals (e.g., 'take bullish RSI only when hh_hl_structure is also bullish' = trade momentum only in confirmed uptrends). Entry open T+1 if traded directly.