bollinger
Bollinger Bands
Bullish: Price crosses above upper Bollinger Band. Bearish: Price crosses below lower Bollinger Band. Bands = SMA ± N standard deviations.
Signal family
Mean reversion — Oscillator-based signals that fire at overbought or oversold extremes — typically fade the prevailing move.
Parameters
| Name | Description | Default | Range |
|---|---|---|---|
| period | SMA period | 20 | 5–100 |
| ub_factor | Upper band std dev factor | 2.0 | 0.5–4.0 |
| lb_factor | Lower band std dev factor | 2.0 | 0.5–4.0 |
Historical context
382,833 valid triggers on 3,613 distinct tickers between 2015-03-10 and 2026-04-22. Universe: us_only · mcap ≥ $100,000,000 · price ≥ $1 (3,614 tickers). Entry at open T+1. 1d = intraday T+1; 20d = open T+1 to close T+20.
Benchmarks: spxew (S&P 500 Equal Weight — the primary benchmark here; a median-stock view that avoids the 2020+ megacap-concentration distortion), spx (S&P 500, cap-weighted), and msci (MSCI World USD). Per-stock regime: trending = ADX(14) ≥ 25, high vol = 20d ann. vol ≥ 20%.
At a glance (20d alpha vs S&P 500 Equal Weight, US-only)
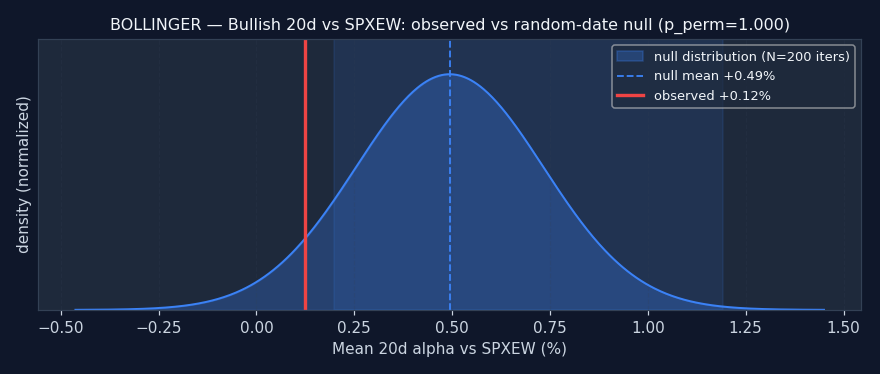
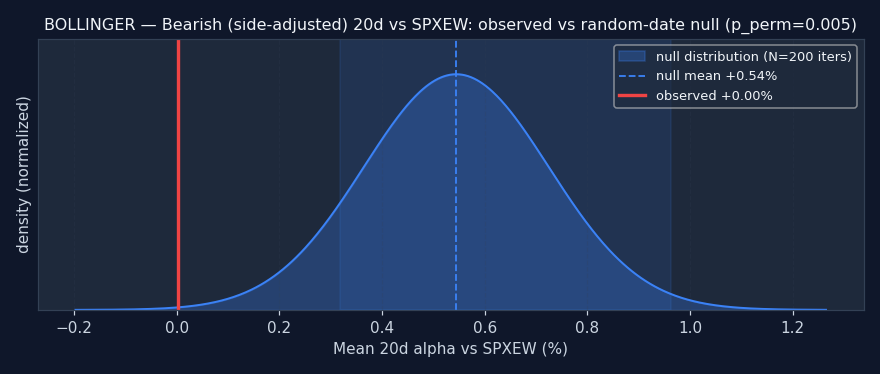
Reading this: the random-date null is: for each ticker, sample N random dates and compute the same alpha — what alpha does a signal with no information produce? If the signal's observed alpha beats the null (pperm≤0.05), it's adding real information. If it's inside or worse than the null, the signal doesn't add value over random firing — any observed alpha is either noise or a universe artifact.
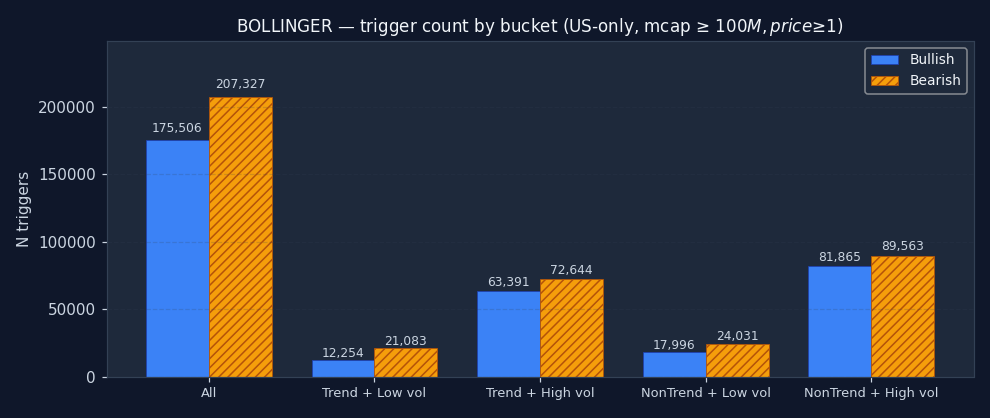
How often does BOLLINGER fire in each regime?
The signal's bucket distribution is itself informative. If 50%+ of all BOLLINGER triggers fire in the "non-trending + high vol" quadrant, the signal is structurally a chop-market event — regardless of what its textbook definition claims. Bullish and bearish are shown separately; counts are across the full US-only sample after the mcap and price floor.
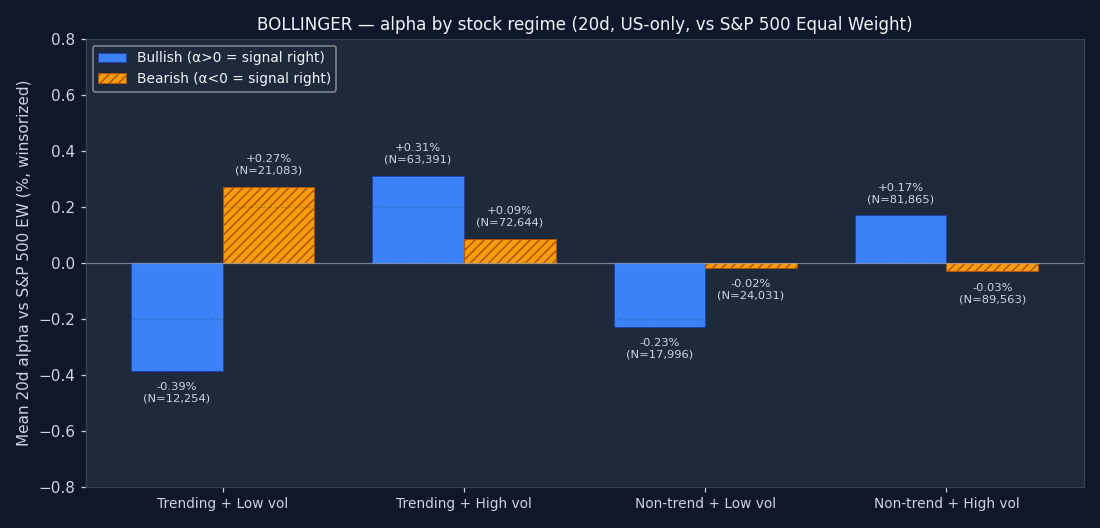
Per-stock regime quadrant — 20d alpha
Each trigger is tagged with the host stock's own technical regime on the trigger date: is the stock itself in a trend (ADX(14) ≥ 25) or ranging? And is its realized 20-day volatility high (≥ 20% annualized) or low? This is the textbook conditioning variable — "does this signal work better in trending stocks?" — answered at the level of the individual stock, not the market. Positive bars are good for the signal; negative bars mean alpha vanishes into the benchmark or worse.
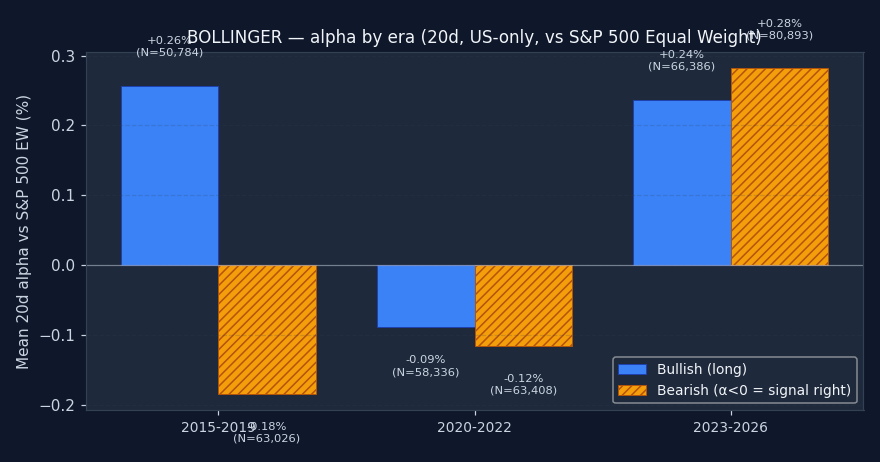
Sub-period check — does the signal work in every era?
A multi-year average can hide major instability. We split the sample into three non-overlapping windows: 2015–2019 (pre-COVID, normalized monetary policy), 2020–2022 (pandemic crash + recovery + rate-shock bear), and 2023+ (post-ZIRP, AI megacap rally). If a signal's alpha is positive overall but comes entirely from one era, that's a red flag — the conditions that produced it may not repeat. A robust signal shows a consistent sign across all non-empty buckets.
↑ Bullish triggers
| Bench | Metric | 1d | 5d | 20d | 60d | 252d |
|---|---|---|---|---|---|---|
| spx | Stock % | -0.12% | +0.10% | +1.15% | +3.69% | +13.09% |
| Bench % | -0.11% | +0.15% | +1.31% | +3.82% | +14.43% | |
| Alpha % | -0.04% | -0.07% | -0.16% | -0.10% | -1.29% | |
| Median alpha | -0.05% | -0.19% | -0.55% | -1.60% | -8.63% | |
| Hit rate (α>0) | 48.7% | 47.9% | 47.2% | 45.7% | 39.6% | |
| p (naive) | <0.001 | <0.001 | <0.001 | 0.0512 | <0.001 | |
| p (HAC) | <0.001 | <0.001 | <0.001 | 0.2275 | 0.0006 | |
| N | 175,438 | 175,254 | 174,176 | 169,687 | 156,508 | |
| msci | Stock % | -0.12% | +0.10% | +1.15% | +3.69% | +13.09% |
| Bench % | -0.04% | +0.15% | +1.17% | +3.41% | +12.34% | |
| Alpha % | -0.06% | -0.09% | -0.04% | +0.29% | +0.75% | |
| Median alpha | -0.11% | -0.24% | -0.46% | -1.22% | -6.48% | |
| Hit rate (α>0) | 47.4% | 47.3% | 47.8% | 46.5% | 42.0% | |
| p (naive) | <0.001 | <0.001 | 0.1975 | <0.001 | <0.001 | |
| p (HAC) | <0.001 | <0.001 | 0.3003 | 0.0005 | 0.0493 | |
| N | 174,978 | 173,527 | 172,814 | 168,795 | 155,966 | |
| spxew | Stock % | -0.12% | +0.10% | +1.15% | +3.69% | +13.09% |
| Bench % | -0.14% | +0.04% | +1.04% | +3.26% | +11.10% | |
| Alpha % | -0.00% | +0.05% | +0.12% | +0.47% | +2.14% | |
| Median alpha | -0.06% | -0.12% | -0.30% | -0.99% | -5.28% | |
| Hit rate (α>0) | 48.6% | 48.7% | 48.5% | 47.1% | 43.2% | |
| p (naive) | 0.5598 | 0.0006 | <0.001 | <0.001 | <0.001 | |
| p (HAC) | 0.5636 | 0.0014 | 0.0004 | <0.001 | <0.001 | |
| N | 174,680 | 173,789 | 172,328 | 168,244 | 154,604 |
Permutation null detail — all horizons × both benchmarks
| Horizon | Bench | Observed α | Null mean | Null 95% CI | pperm |
|---|---|---|---|---|---|
| 1d | spx | -0.04% | -0.00% | [-0.03%, +0.46%] | 0.990 |
| 1d | msci | -0.06% | -0.02% | [-0.05%, +0.44%] | 0.995 |
| 1d | spxew | -0.00% | -0.02% | [-0.06%, +0.44%] | 0.040 |
| 5d | spx | -0.07% | +0.21% | [-0.02%, +0.82%] | 1.000 |
| 5d | msci | -0.09% | +0.21% | [-0.01%, +0.83%] | 1.000 |
| 5d | spxew | +0.05% | +0.23% | [+0.00%, +0.85%] | 0.781 |
| 20d | spx | -0.16% | +0.30% | [+0.00%, +0.99%] | 1.000 |
| 20d | msci | -0.04% | +0.42% | [+0.13%, +1.12%] | 1.000 |
| 20d | spxew | +0.12% | +0.49% | [+0.20%, +1.19%] | 1.000 |
| 60d | spx | -0.10% | +0.47% | [+0.10%, +1.17%] | 1.000 |
| 60d | msci | +0.29% | +0.92% | [+0.51%, +1.62%] | 1.000 |
| 60d | spxew | +0.47% | +1.14% | [+0.76%, +1.86%] | 1.000 |
| 252d | spx | -1.29% | +0.66% | [+0.10%, +1.63%] | 1.000 |
| 252d | msci | +0.75% | +2.99% | [+2.43%, +3.94%] | 1.000 |
| 252d | spxew | +2.14% | +4.33% | [+3.77%, +5.31%] | 1.000 |
Example triggers on US large-caps (2023+, mcap ≥ $30B)
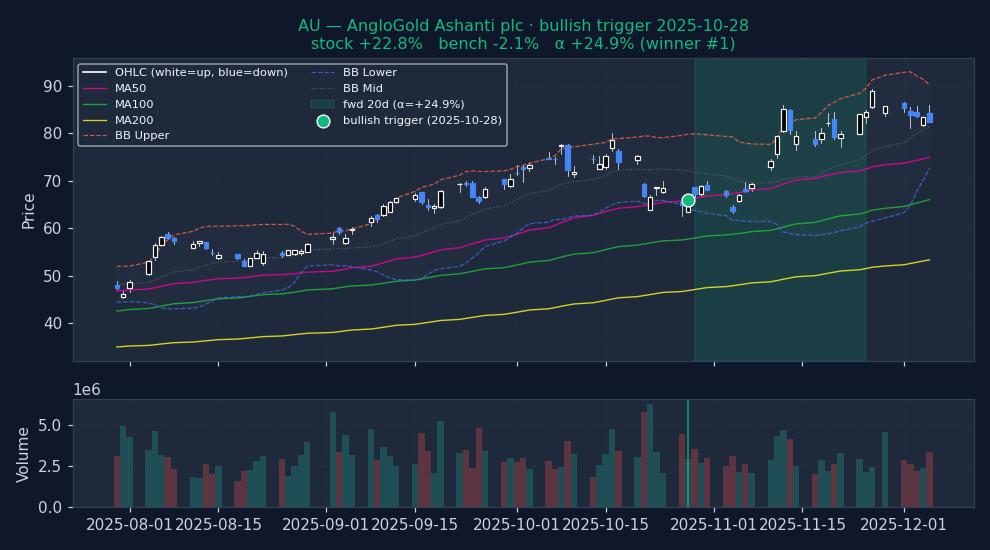
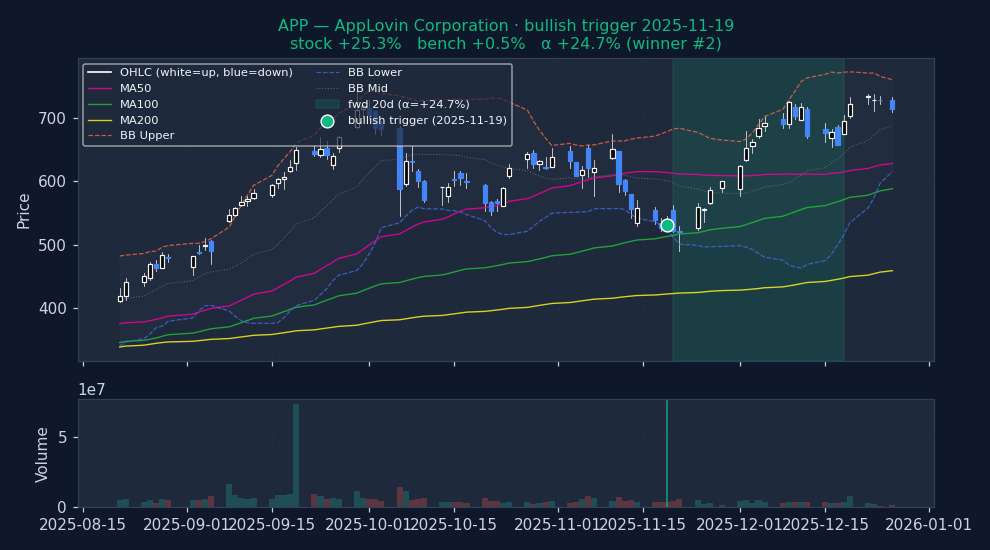
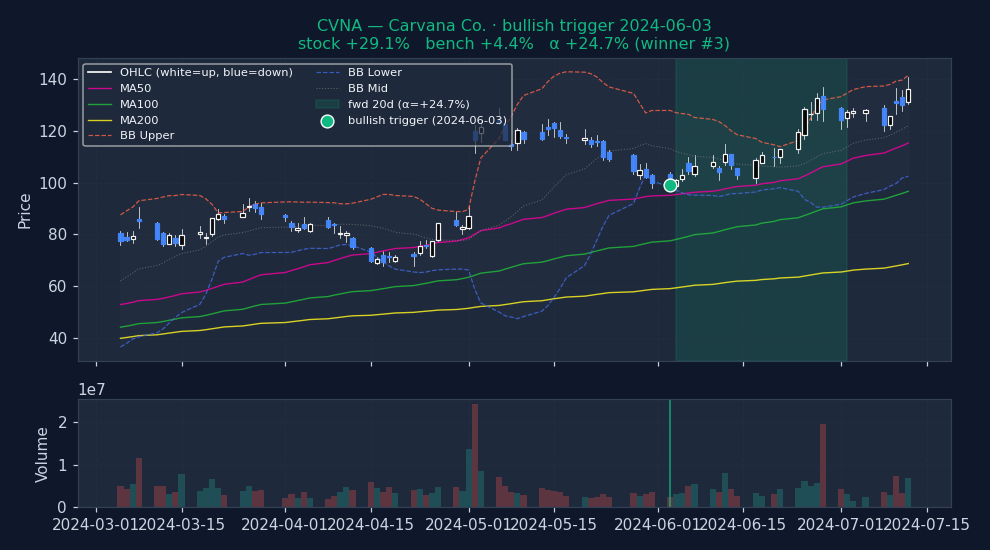
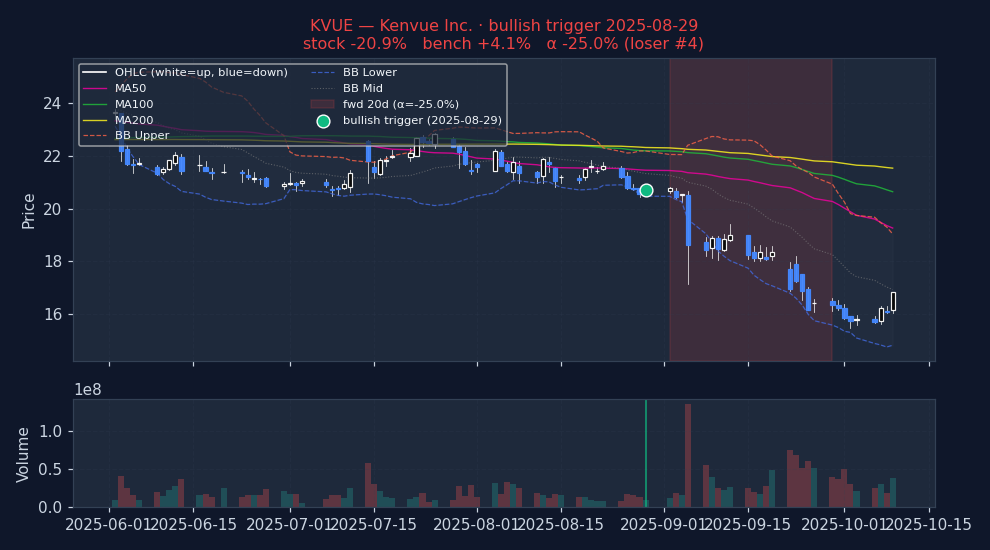
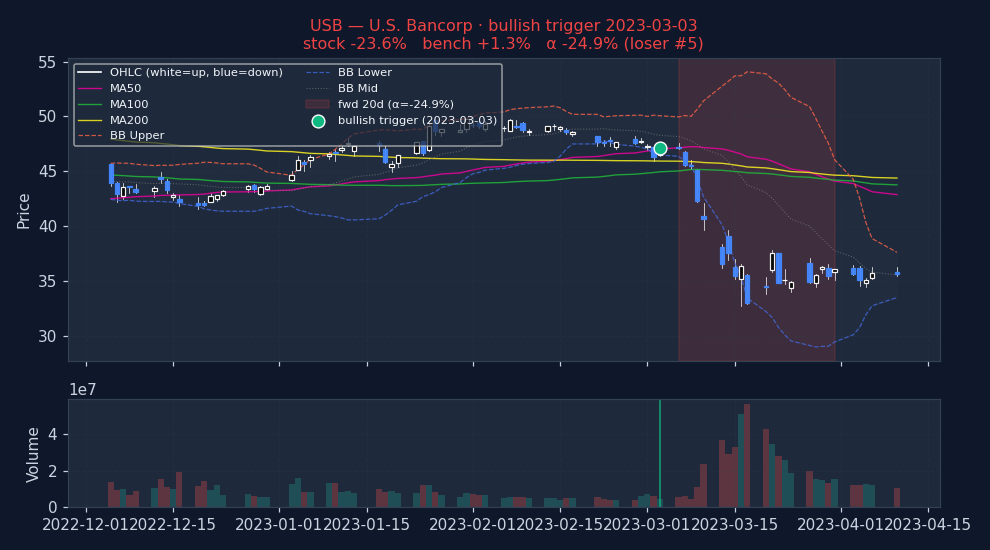
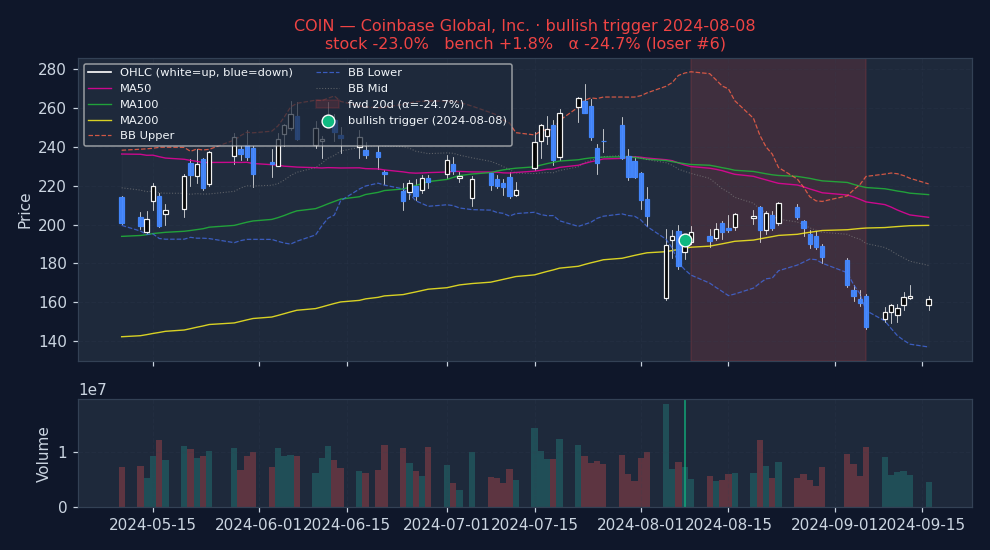
Six recent bullish BOLLINGER triggers on US mega-caps, filtered to |alpha| ≤ 25% to exclude catalyst-driven outliers (earnings surprises, M&A, binary events). The first three are the strongest outcomes — what the signal looks like when it works. The last three are the weakest — what the signal looks like when it fails. Each chart shows the stock's price with signal-appropriate technical overlays (e.g. MACD subpanel on MACD pages, Bollinger Bands on Bollinger pages, the 52-week trailing max line on 52w-high pages), a dot marking the trigger date, and the forward window shaded (green when the signal was right, red when it wasn't). Click any chart to open full-size.
Strongest outcomes (what BOLLINGER looks like when it works)
Weakest outcomes (what BOLLINGER looks like when it fails)
Stock-regime quadrants (2×2 per-stock, 20d alpha detail table)
| Quadrant | N | Stock % (spx) | Bench % (spx) | Alpha % (spx) | p (HAC) | Stock % (msci) | Bench % (msci) | Alpha % (msci) | p (HAC) | Stock % (spxew) | Bench % (spxew) | Alpha % (spxew) | p (HAC) |
|---|---|---|---|---|---|---|---|---|---|---|---|---|---|
| Trending + Low vol Clean directional grind, low whipsaw | 12,254 | +0.12% | +0.80% | -0.66% | <0.001 | +0.12% | +0.62% | -0.48% | <0.001 | +0.12% | +0.57% | -0.39% | <0.001 |
| Trending + High vol Crisis selloff or parabolic rally | 63,391 | +1.41% | +1.63% | -0.20% | 0.0021 | +1.41% | +1.38% | +0.04% | 0.5386 | +1.41% | +1.12% | +0.31% | <0.001 |
| Non-trending + Low vol Quiet chop, summer doldrums | 17,996 | +0.25% | +0.82% | -0.54% | <0.001 | +0.25% | +0.66% | -0.39% | <0.001 | +0.25% | +0.52% | -0.23% | <0.001 |
| Non-trending + High vol Classical "whipsaw zone" for momentum | 81,865 | +1.33% | +1.31% | +0.05% | 0.3315 | +1.33% | +1.30% | +0.08% | 0.1417 | +1.33% | +1.24% | +0.17% | 0.0012 |
Sub-period breakdown table (20d alpha)
| Period | N | Alpha % (spx) | p (HAC) | Alpha % (msci) | p (HAC) | Alpha % (spxew) | p (HAC) |
|---|---|---|---|---|---|---|---|
| 2015-2019 2015-01-01 → 2020-01-01 | 50,784 | +0.21% | <0.001 | +0.40% | <0.001 | +0.26% | <0.001 |
| 2020-2022 2020-01-01 → 2023-01-01 | 58,336 | -0.25% | 0.0002 | +0.04% | 0.5366 | -0.09% | 0.1762 |
| 2023-2026 2023-01-01 → 2099-01-01 | 66,386 | -0.37% | <0.001 | -0.43% | <0.001 | +0.24% | <0.001 |
↓ Bearish triggers negative alpha = signal was right (stock underperformed market)
| Bench | Metric | 1d | 5d | 20d | 60d | 252d |
|---|---|---|---|---|---|---|
| spx | Stock % | -0.05% | +0.15% | +0.64% | +2.16% | +11.98% |
| Bench % | +0.01% | +0.19% | +0.93% | +2.81% | +13.31% | |
| Alpha % | -0.05% | -0.03% | -0.22% | -0.62% | -1.30% | |
| Median alpha | -0.05% | -0.16% | -0.79% | -2.08% | -8.13% | |
| Hit rate (α>0) | 48.5% | 48.1% | 45.8% | 44.1% | 39.9% | |
| p (naive) | <0.001 | 0.0195 | <0.001 | <0.001 | <0.001 | |
| p (HAC) | <0.001 | 0.0268 | <0.001 | <0.001 | 0.0004 | |
| N | 207,233 | 206,062 | 204,083 | 200,578 | 178,456 | |
| msci | Stock % | -0.05% | +0.15% | +0.64% | +2.16% | +11.98% |
| Bench % | +0.02% | +0.17% | +0.79% | +2.34% | +10.70% | |
| Alpha % | -0.07% | -0.02% | -0.07% | -0.12% | +1.27% | |
| Median alpha | -0.06% | -0.15% | -0.62% | -1.58% | -5.50% | |
| Hit rate (α>0) | 48.2% | 48.2% | 46.6% | 45.4% | 43.1% | |
| p (naive) | <0.001 | 0.1173 | 0.0044 | 0.0139 | <0.001 | |
| p (HAC) | <0.001 | 0.1373 | 0.0265 | 0.1499 | 0.0005 | |
| N | 206,392 | 205,119 | 203,251 | 199,124 | 177,566 | |
| spxew | Stock % | -0.05% | +0.15% | +0.64% | +2.16% | +11.98% |
| Bench % | +0.03% | +0.19% | +0.72% | +1.99% | +9.66% | |
| Alpha % | -0.07% | -0.03% | +0.00% | +0.22% | +2.52% | |
| Median alpha | -0.06% | -0.14% | -0.53% | -1.24% | -4.43% | |
| Hit rate (α>0) | 48.3% | 48.4% | 47.1% | 46.4% | 44.2% | |
| p (naive) | <0.001 | 0.0190 | 0.9168 | <0.001 | <0.001 | |
| p (HAC) | <0.001 | 0.0265 | 0.9354 | 0.0053 | <0.001 | |
| N | 206,298 | 204,176 | 202,559 | 199,054 | 176,589 |
Permutation null detail — all horizons × both benchmarks
| Horizon | Bench | Observed α | Null mean | Null 95% CI | pperm |
|---|---|---|---|---|---|
| 1d | spx | -0.05% | -0.01% | [-0.03%, -0.00%] | 0.005 |
| 1d | msci | -0.07% | -0.03% | [-0.05%, -0.02%] | 0.005 |
| 1d | spxew | -0.07% | -0.03% | [-0.05%, -0.02%] | 0.005 |
| 5d | spx | -0.03% | +0.20% | [+0.01%, +0.80%] | 0.005 |
| 5d | msci | -0.02% | +0.21% | [+0.01%, +0.81%] | 0.005 |
| 5d | spxew | -0.03% | +0.23% | [+0.04%, +0.83%] | 0.005 |
| 20d | spx | -0.22% | +0.35% | [+0.12%, +0.77%] | 0.005 |
| 20d | msci | -0.07% | +0.47% | [+0.25%, +0.88%] | 0.005 |
| 20d | spxew | +0.00% | +0.54% | [+0.32%, +0.96%] | 0.005 |
| 60d | spx | -0.62% | +0.74% | [+0.49%, +1.17%] | 0.005 |
| 60d | msci | -0.12% | +1.19% | [+0.93%, +1.60%] | 0.005 |
| 60d | spxew | +0.22% | +1.41% | [+1.16%, +1.82%] | 0.005 |
| 252d | spx | -1.30% | +2.11% | [+1.68%, +2.58%] | 0.005 |
| 252d | msci | +1.27% | +4.42% | [+3.99%, +4.85%] | 0.005 |
| 252d | spxew | +2.52% | +5.78% | [+5.34%, +6.27%] | 0.005 |
Example triggers on US large-caps (2023+, mcap ≥ $30B)
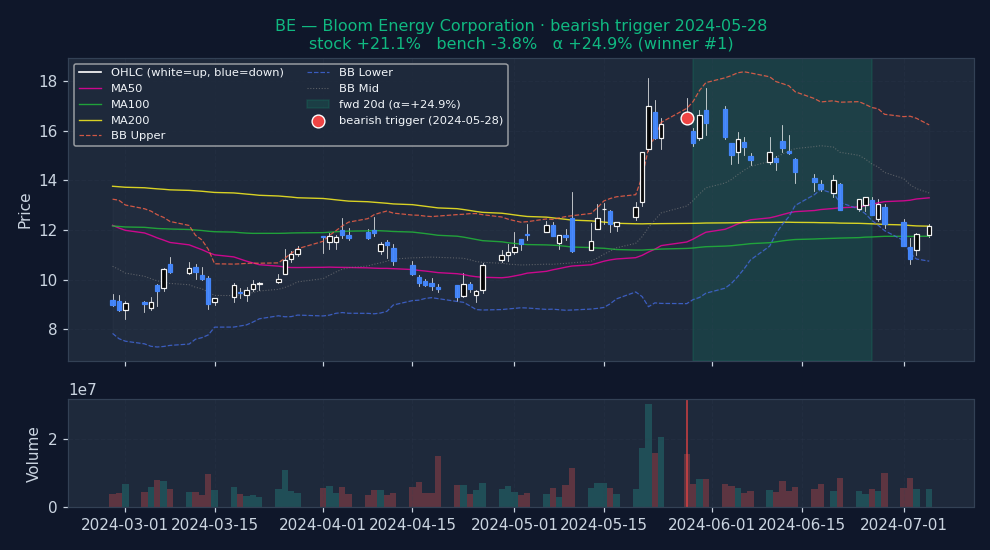
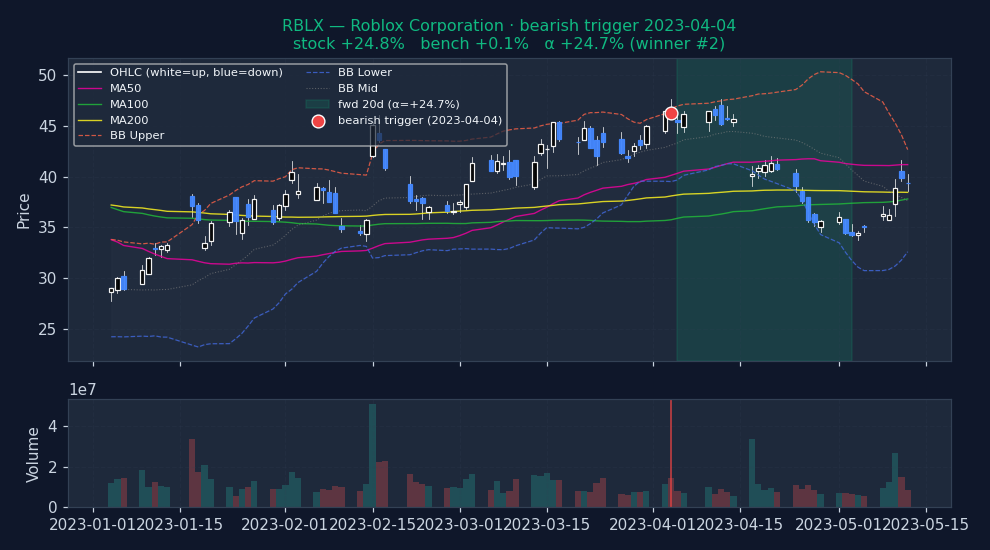
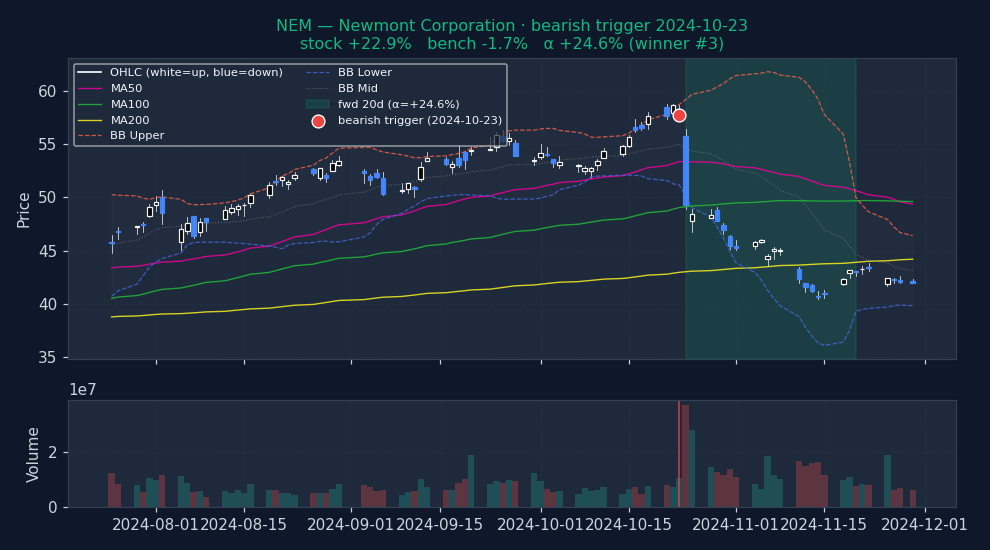
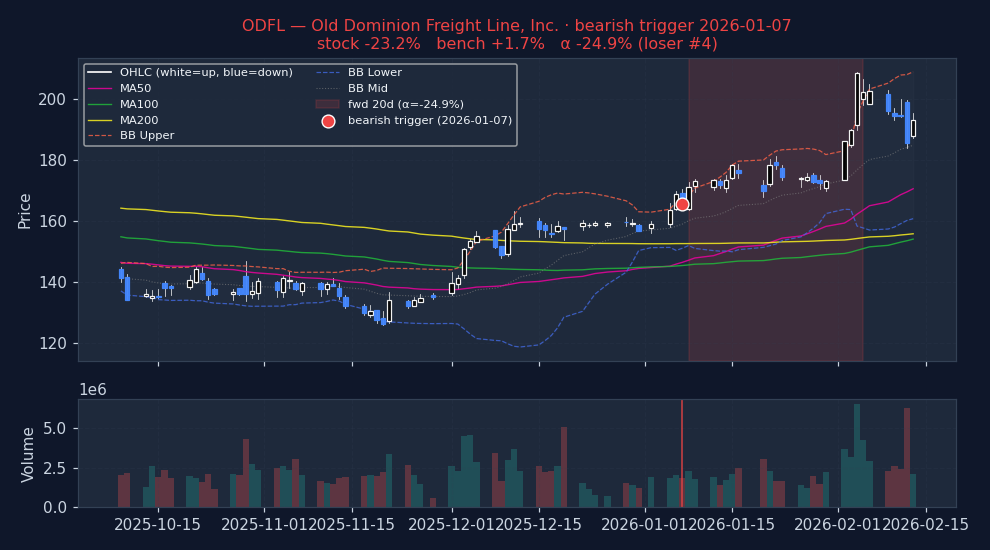
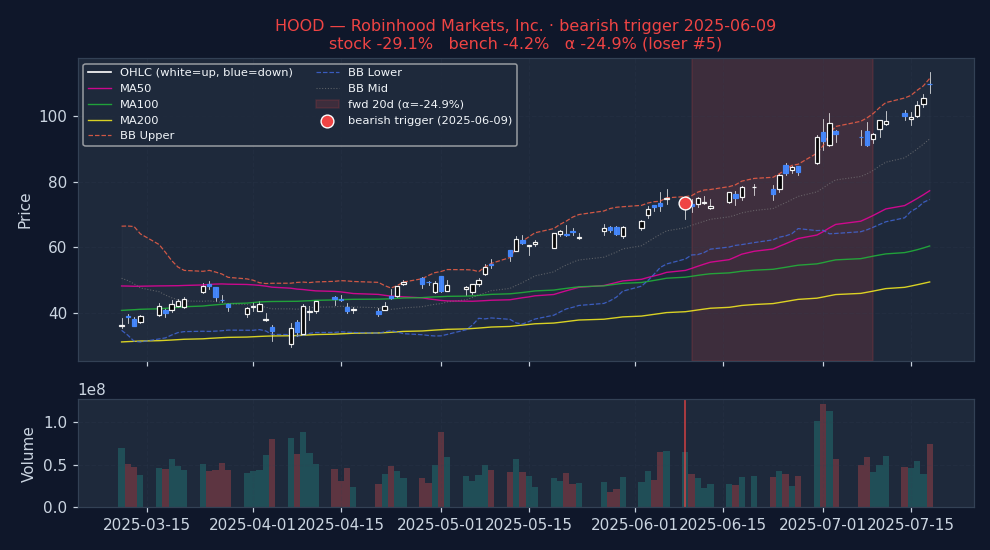
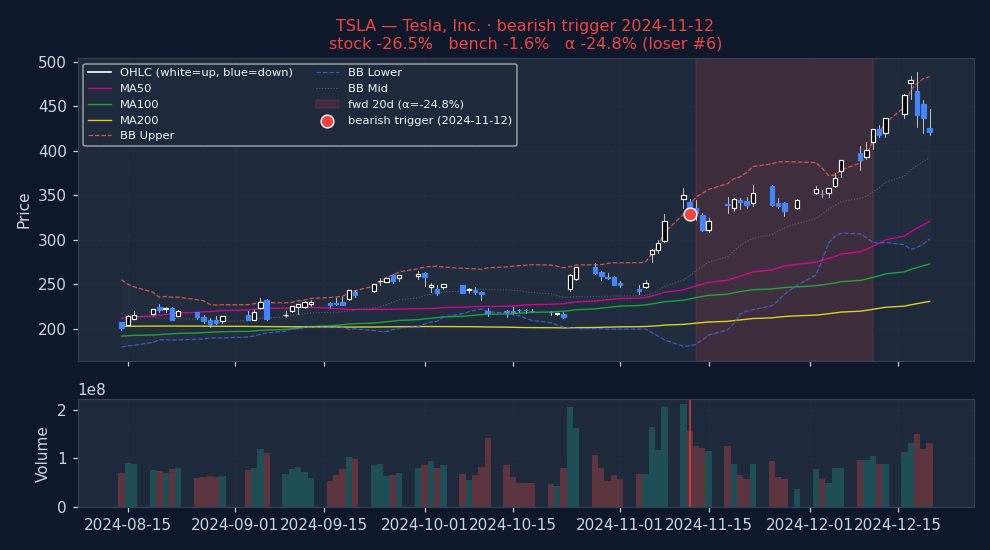
Six recent bearish BOLLINGER triggers on US mega-caps, filtered to |alpha| ≤ 25% to exclude catalyst-driven outliers (earnings surprises, M&A, binary events). The first three are the strongest outcomes — what the signal looks like when it works. The last three are the weakest — what the signal looks like when it fails. Each chart shows the stock's price with signal-appropriate technical overlays (e.g. MACD subpanel on MACD pages, Bollinger Bands on Bollinger pages, the 52-week trailing max line on 52w-high pages), a dot marking the trigger date, and the forward window shaded (green when the signal was right, red when it wasn't). Click any chart to open full-size.
Strongest outcomes (what BOLLINGER looks like when it works)
Weakest outcomes (what BOLLINGER looks like when it fails)
Stock-regime quadrants (2×2 per-stock, 20d alpha detail table)
| Quadrant | N | Stock % (spx) | Bench % (spx) | Alpha % (spx) | p (HAC) | Stock % (msci) | Bench % (msci) | Alpha % (msci) | p (HAC) | Stock % (spxew) | Bench % (spxew) | Alpha % (spxew) | p (HAC) |
|---|---|---|---|---|---|---|---|---|---|---|---|---|---|
| Trending + Low vol Clean directional grind, low whipsaw | 21,083 | +0.37% | +0.46% | -0.07% | 0.1595 | +0.37% | +0.25% | +0.13% | 0.0119 | +0.37% | +0.11% | +0.27% | <0.001 |
| Trending + High vol Crisis selloff or parabolic rally | 72,644 | +0.82% | +1.03% | -0.15% | 0.0325 | +0.82% | +0.90% | +0.01% | 0.9448 | +0.82% | +0.83% | +0.09% | 0.2079 |
| Non-trending + Low vol Quiet chop, summer doldrums | 24,031 | +0.28% | +0.62% | -0.34% | <0.001 | +0.28% | +0.41% | -0.11% | 0.0144 | +0.28% | +0.32% | -0.02% | 0.6870 |
| Non-trending + High vol Classical "whipsaw zone" for momentum | 89,563 | +0.78% | +1.03% | -0.20% | <0.001 | +0.78% | +0.91% | -0.08% | 0.1015 | +0.78% | +0.86% | -0.03% | 0.5324 |
Sub-period breakdown table (20d alpha)
| Period | N | Alpha % (spx) | p (HAC) | Alpha % (msci) | p (HAC) | Alpha % (spxew) | p (HAC) |
|---|---|---|---|---|---|---|---|
| 2015-2019 2015-01-01 → 2020-01-01 | 63,026 | -0.49% | <0.001 | -0.26% | <0.001 | -0.18% | <0.001 |
| 2020-2022 2020-01-01 → 2023-01-01 | 63,408 | +0.02% | 0.7681 | +0.14% | 0.0282 | -0.12% | 0.0711 |
| 2023-2026 2023-01-01 → 2099-01-01 | 80,893 | -0.17% | 0.0075 | -0.05% | 0.3887 | +0.28% | <0.001 |
Methodology and caveats
How to read. Entry at open of T+1 (one trading day after the signal fires on close of T). 20d = open T+1 to close T+20. Alpha = stock return − benchmark return over the same window (Convention A, single-sided, textbook). For bullish triggers, POSITIVE alpha = signal was right. For bearish triggers, NEGATIVE alpha = signal was right (stock underperformed market). No sign-flipping; the direction of the bet determines what "good" looks like. Per-stock regime is each stock's own ADX(14) and RV(20) at the trigger date — not market-wide state.
Three p-values, three robustness tests. (a) p_naive: scipy one-sample t-test on winsorized alphas. Optimistic because overlapping 20d windows on the same ticker inflate effective N. (b) p_hac: Newey-West HAC with lag = horizon — corrects for the overlap and is the academic-finance standard. (c) p_perm: fraction of 200 random-date null iterations with mean ≥ observed. Tests whether the signal beats random date selection at all. A signal that clears all three (pnaive, phac, pperm all < 0.05) has real information; a signal that fails pperm has zero edge even if the t-test says "significant."
Caveats. (i) Universe reflects today's active tickers; delisted losers pruned → survivorship bias. (ii) Mcap ≥ $100M filter uses today's snapshot, not point-in-time — mild lookahead on which stocks enter the sample, not on returns. (iii) Means and p-values use winsorized alphas (1/99 percentile) to prevent data errors from dominating. Medians and hit rates use raw data. (iv) Zero transaction costs assumed. Realistic bid-ask + commissions remove 20–40bps from 20d alpha on US large-caps, more on small-cap. Sub-20bps alpha is noise in practice. (v) Past performance does not predict future results.
How to use this
1 · When to reach for this signal
Caution recommended. Bullish 20d alpha is -0.16% and worse than random — triggering on random dates would have produced better long-side returns. Either direction fails the "beats random" test. Don't use Bollinger Bands as a standalone entry trigger. It may still be useful as part of a composite (section 4).
2 · When it works — the setups that drive it
- Best bullish setup: Non-trending + High vol — alpha +0.05% / 20d on 81,865 historical triggers.
- Best bearish setup: Trending + Low vol — alpha -0.07% / 20d on 21,083 historical triggers.
- Best era for bullish: 2015-2019 — alpha +0.21% / 20d.
- Best era for bearish: 2020-2022 — alpha +0.02% / 20d.
3 · When it fails — common false positives
- Weakest bullish cell: Trending + Low vol — alpha -0.66% / 20d on 12,254 triggers.
- Weakest bearish cell: Non-trending + Low vol — alpha -0.34% / 20d on 24,031 triggers.
- Worst era for bullish: 2023-2026 — alpha -0.37% / 20d.
- Worst era for bearish: 2015-2019 — alpha -0.49% / 20d.
Signal-specific failure patterns
4 · Pairing inside a screen
The statements below describe how this signal relates to others by construction — which indicator family it belongs to, and where same-family redundancy might reduce the independence of evidence inside a Daily Report. These are taxonomic classifications drawn from standard technical-analysis texts; they are not pairing backtests. A multi-signal convergence backtest is planned but not yet run.
Volatility-envelope construction
Bollinger Bands are a volatility envelope: a 20-period simple moving average ± 2 standard deviations of price (Bollinger, Bollinger on Bollinger Bands, 2001). This construction is distinct from momentum oscillators (RSI, Stochastics, Williams %R, CCI) and from moving-average crossover signals, so pairing Bollinger with any one of them does not produce same-family redundancy.
What would likely rescue this signal
This block calls out the data or conditions that could turn a technically weak signal into a usable one in a composite screen. Based on signal mechanics and the observed failure patterns above; individual combinations are not yet backtested.
- Volume-filter the bullish side — A lower-band touch on HIGH volume is capitulation; on low volume is drift. A bullish filter requiring volume > 1.5× average + a follow-through close above T+1 open might isolate real reversals from continuing drawdowns. Not currently implemented in the screen filter layer.
- Regime gate the bullish side — Bullish Bollinger worked 2015-2019 and broke 2020+. A filter requiring 'market breadth > 55%' (most stocks above 50DMA) or 'SPX not within 5% of ATH' might carve out the residual mean-reversion regime.
- Hold the bearish trade to 60d — Bearish edge doubles from 20d to 60d (−0.22 → −0.62). Short-horizon exits on Bollinger bearish leave alpha on the table. This argues for a time-stop rather than a profit-target exit — hold the full 60d window absent a structural invalidation (stock taking out its upper-band high by > 2%).
See also Why technical-only signals don't survive on their own for the broader argument.
5 · Before you act — a 5-point checklist
- Normal trading day? Rule out earnings (within ±3 days), ex-dividend, or known corporate-action dates — the signal is almost certainly reading noise, not momentum, in those windows.
- Where is price vs its own 50 / 200 DMA? A mean-reversion signal firing against the long-term trend (e.g. oversold in a clean uptrend) is much more reliable than one firing with it.
- What's the sector breadth doing? An isolated signal in a broadly down-trending sector is a lower-confidence setup than one firing with the rest of its peer group.
- Is ADV20 enough for your size? If the trigger is on a $500M name and you want to move $1M notional, you're the tape. Consider adv20d ≥ 5% of your intended position.
- What invalidates you? Define a price level (for longs: a close below the trigger-day low; for shorts: close above the trigger-day high) and honor it. The backtest alpha is an average; any one trade can be at either tail.
Execution notes
Bearish upper-band touches are the only tradable direction here. 20d and 60d both deliver real alpha; 60d compounds more but adds event risk. Entry = open T+1. The bullish lower-touch trade is a structural loser — stocks touching their lower band in a bull market are usually breaking down, not pausing. Note: Bollinger Bands period/std-dev parameters matter a lot; this backtest uses 20-period / 2 stdev which is the Lambert default. Tighter parameters (shorter window, lower stdev) would fire more often on smaller deviations — likely noisier.